Ansys Learning Forum › Forums › Discuss Simulation › Fluids › Aqwa – Field points definition › Reply To: Aqwa – Field points definition
Dear Shuangxing Du,
thank you very much for the quick feedback.
Indeed, this is the type of information I was looking for.
To get acquainted with the tool, I am now trying to cross-check the output from AqwaFlow with the graphical output that can be obtained from Hydrodynamic Diffraction => Solution => Max wave elevation
as, for a given point, the max wave elevation (incident+diffracted+radiated without 2nd order effects) is expected (at least, I expect it) to be equal to the amplitude from AqwaFlow.
I'm getting results that look consistent.
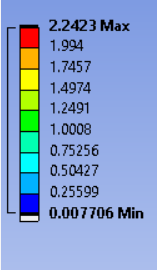
However, I have some issues in refining the visual comparison due to the fact that I do not find a way to modify the color scale that is automatically obtained in the graphica output:
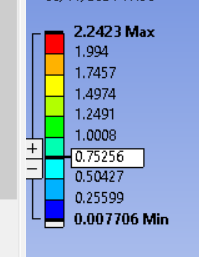
Clicking on the numbers, some boxes appear as if the levels were editable:
but, in reality, I cannot edit them / whatever I do is not reflected in the scale.
Right clicking on the scale shows also the possibility of changing the color scheme. However, even if I select a different colo scheme, the plot still uses the default rainbow.
Do you know whether there is a way to modify at least the min-max range of the color scale ?
Also, do you know whether it is possible to export the results from max wave elevation plot, or, in general, wave elevation data for the wave grid, in an external output file ?
Thank you,
Gabriele


