Ansys Learning Forum › Forums › Discuss Simulation › Fluids › Single floating structure Ansys AQWA › Reply To: Single floating structure Ansys AQWA
 S.S.S.ShankaVasuki
Hi,
Thank you for your response. Here are the observations.
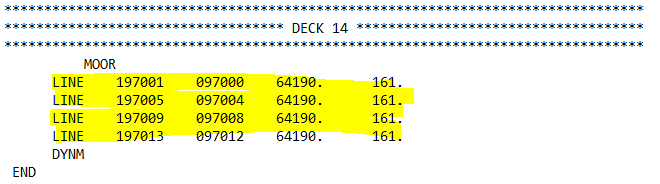
1) The connection stiffness matrix is disabled in the diffraction analysis but as it is considered in the time domain analysis in the data category 14 with LINE data records as shown below. It clearly shows that the additional damping matrix is considered in the simulation. But the values in the RAO based response in the TD analysis does not change even if I change the damping matrix. Only the values for the actual response change. This is a bit strange. Does this mean that the additional damping has no effect in the time domain analysis?
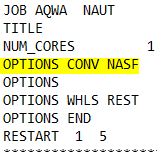
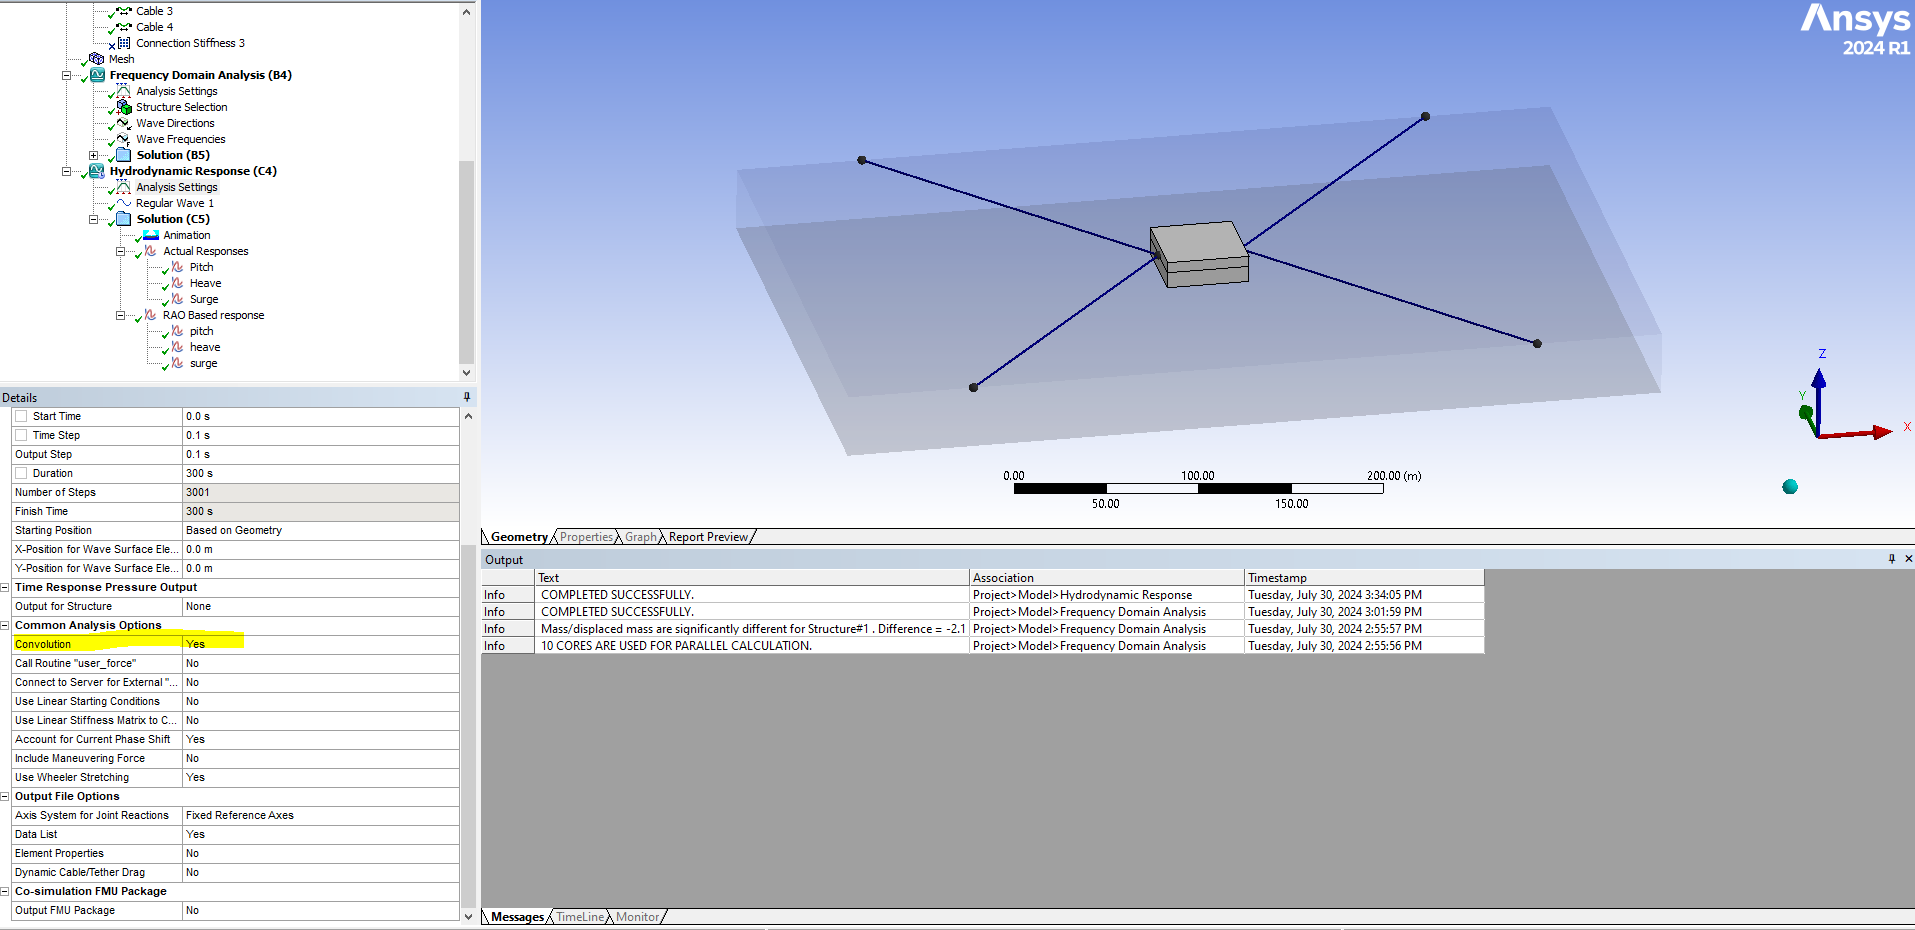
2) The convolution option in the analysis setting is enbled (“yes”) as shown in the image. Is this the option you are referring to? or is there another option called CONV?
3) I tried your method of calculating the RAO as per the formula RAO_TD = (0.5 * difference between crest and trough)/ (wave amplitude) and I get the following results. The plot looks much better now. But could you explain why I need to use this formula?
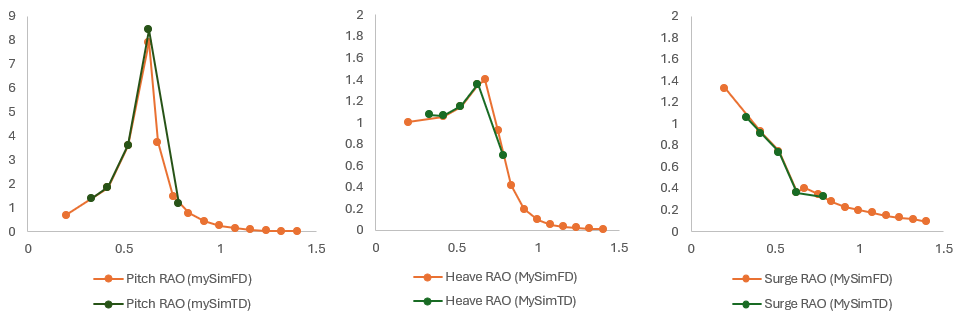
4) I cannot use a smaller amplitude as the reference article mentions a particular amplitude for each of the frequencies. And if I reduce the amplitude, I might get better results, but I dont think that is the right way (please correct me if I am wrong).
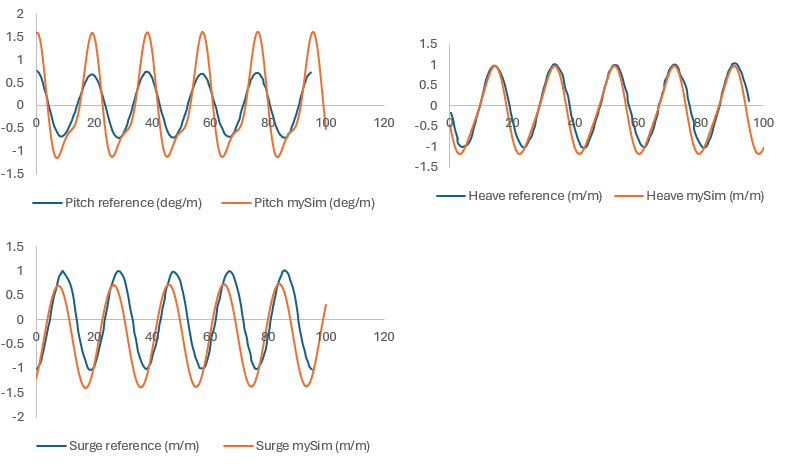
The last and the only question that still persists is as to why is the actual response of the time domain analysis not matching with the reference article. I get higher pitch and surge responses as shown below (in this fig, wave frequency is 0.33 rad/sec and amplitude is 1.12m). Also I notice that the reference article has equal amplitude above and below the zero line where as in the actual response of my time domain analysis, I get unequal amplitude above and below the zero line. So I am not sure on how to match these plots. Because this is the last plot I need to validate and it would be nice if you could help me with this.
So is there anything else I can try to get a better match? :)


