Ansys Learning Forum › Forums › Discuss Simulation › Photonics › Blazed grating › Reply To: Blazed grating
Hi Judy,
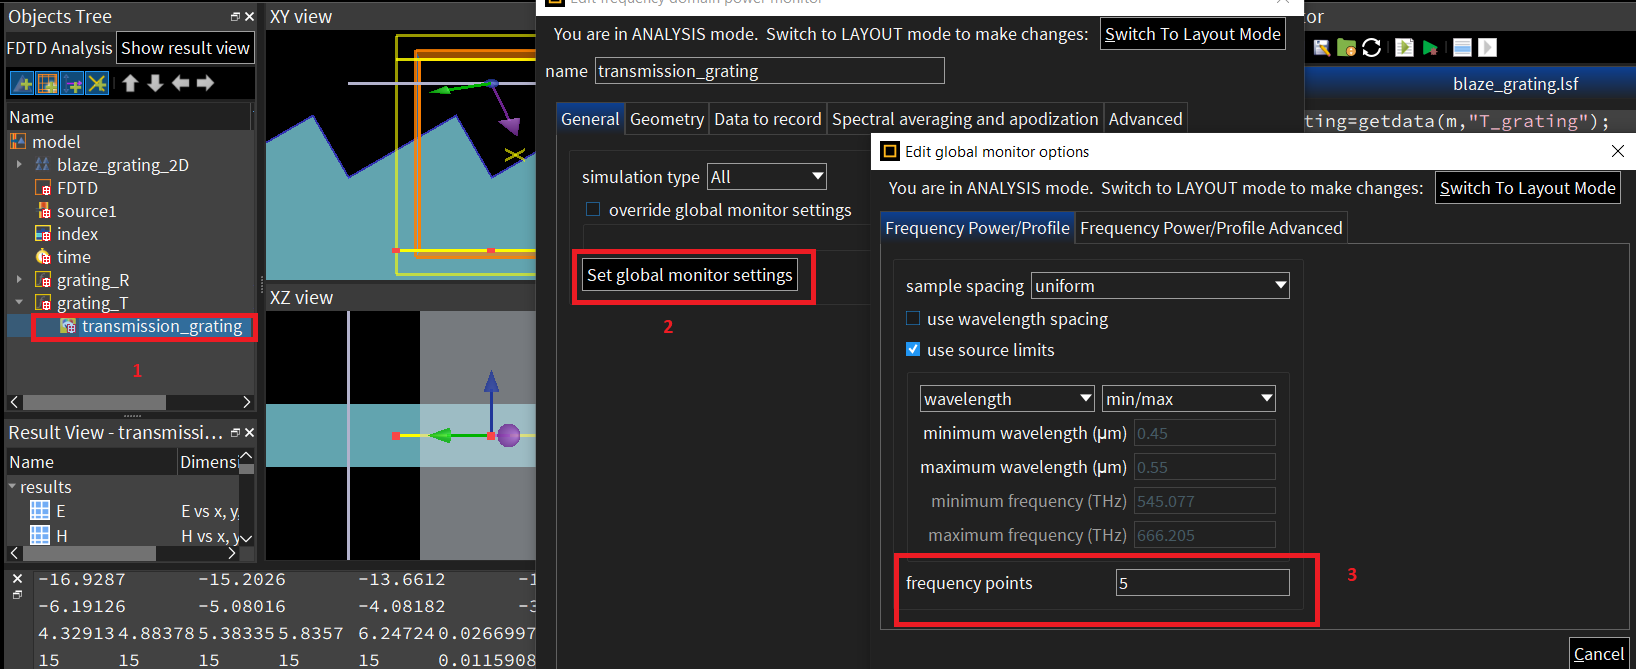
The example is a single wavelength simulation. If you are running a broadband simulation, then make sure that the monitor is accounting for a large number of wavelengths. Currently, if you look at the global monitor the data is being recorded at 1 frequency point. You can change it to include more frequencies.
Once you do that, the dimension of the results would change, so we have to make sure that the plot command is modified (put in a loop) accordingly. As an example, here I have only used 5 frequency points, so I plot the reflection orders and the corresponding power 5 times, for each frequency/wavelength point using a for loop:
for(i=1:1:5)#for 5 frequency points
{
plot(theta(:,i),R_grating(:,i),
"angle (degrees)",
"fraction of reflected power",
"order strength",
"plot points");
}
If you use 100 frquency points, you will see 100 plots, so if you are interested only in specific wavelengths you can find their indices and plot the corresponding orders. Please feel free to let me know in case I missed anything.
Regards,
Amrita


