Ansys Learning Forum › Forums › Discuss Simulation › General Mechanical › How to add annotations or probes using python in Mechanical 2020 version? › Reply To: How to add annotations or probes using python in Mechanical 2020 version?
There is no javascript function to select a location/node on the model or specify an xyz that project to the model in 2020 R1. This is in complied code. So you couldn't make an annotation entirely by script in older versions. This is why they added the feature in newer versions. For 2022 R1 and later see documentation at:
"Mechanical Application > Scripting in Mechanical Guide > Scripting Examples > Script Examples for Interacting with Results > Finding Hot Spots"
Look at the end of the code. It is done in a method similar to the following:
resultObject=ExtAPI.DataModel.GetObjectsByName('Equivalent Stress')[0]
probeLabel = Graphics.LabelManager.CreateProbeLabel(resultObject)
probeLabel.Scoping.Node=1464
probeLabel.Note = "hello"
This method will print a result value as well as the node ID and a label.
You can create a custom annotation in the following way, which will work in 2020 R1 as well as the current 2024 R1:
Point3D = ExtAPI.Graphics.CreateWorldPoint
Pt = Point3D(0.1, 0, 0) # XYZ location in geometry units
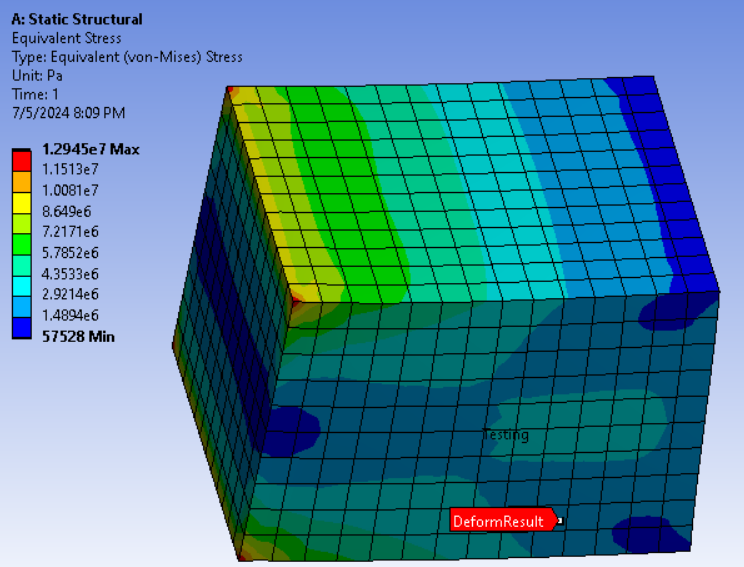
Label = ExtAPI.Graphics.Scene.Factory2D.CreateText(Pt, "Testing")
Label.Color = 0x000000 # black
You can see the word "Testing" in the image above, but it doesn't show very well because it doesn't have a border with background color. This is an enhancement that has been submitted previously. You can use a different text color, but depending on the contour color where you place it, it still may not show well. Maybe if you use a color that's not used in the contour, such as purple, assuming the independent bands are not turned on, of which the top band is purple. Or maybe white, assuming the label doesn't extend over the background.
Here is another way which uses the unpublished InternalObject. Think of this as a beta option. Anything under the InternalObject may not work right or at all; it may not be documented; and it's only available on Windows:
defResult = ExtAPI.DataModel.Project.Model.Analyses[0].Solution.Children[1]
ds=ExtAPI.DataModel.InternalObject["ds"]
labelID=ds.Graphics.AddLabel(defResult.ObjectId, 520, "DeformResult", 0.024, 0.004136, 0.0082857, 0x0000ff)
# Arguments are: ObjectID, classID(520 for result), X_coor, Y_coor, Z_coor, color
# This just creates an annotation probe with text "DeformResult" not the value of a result at that location
ExtAPI.Graphics.Redraw()
You can see this above as the red background label.
The two examples above are only for custom text labels. This is no way to create an annotation by script entirely in 2020 R1 that displays a result value.


