Ansys Learning Forum › Forums › Discuss Simulation › LS Dyna › Problems with fatigue calculations › Reply To: Problems with fatigue calculations
June 4, 2024 at 4:26 pm
Subscriber
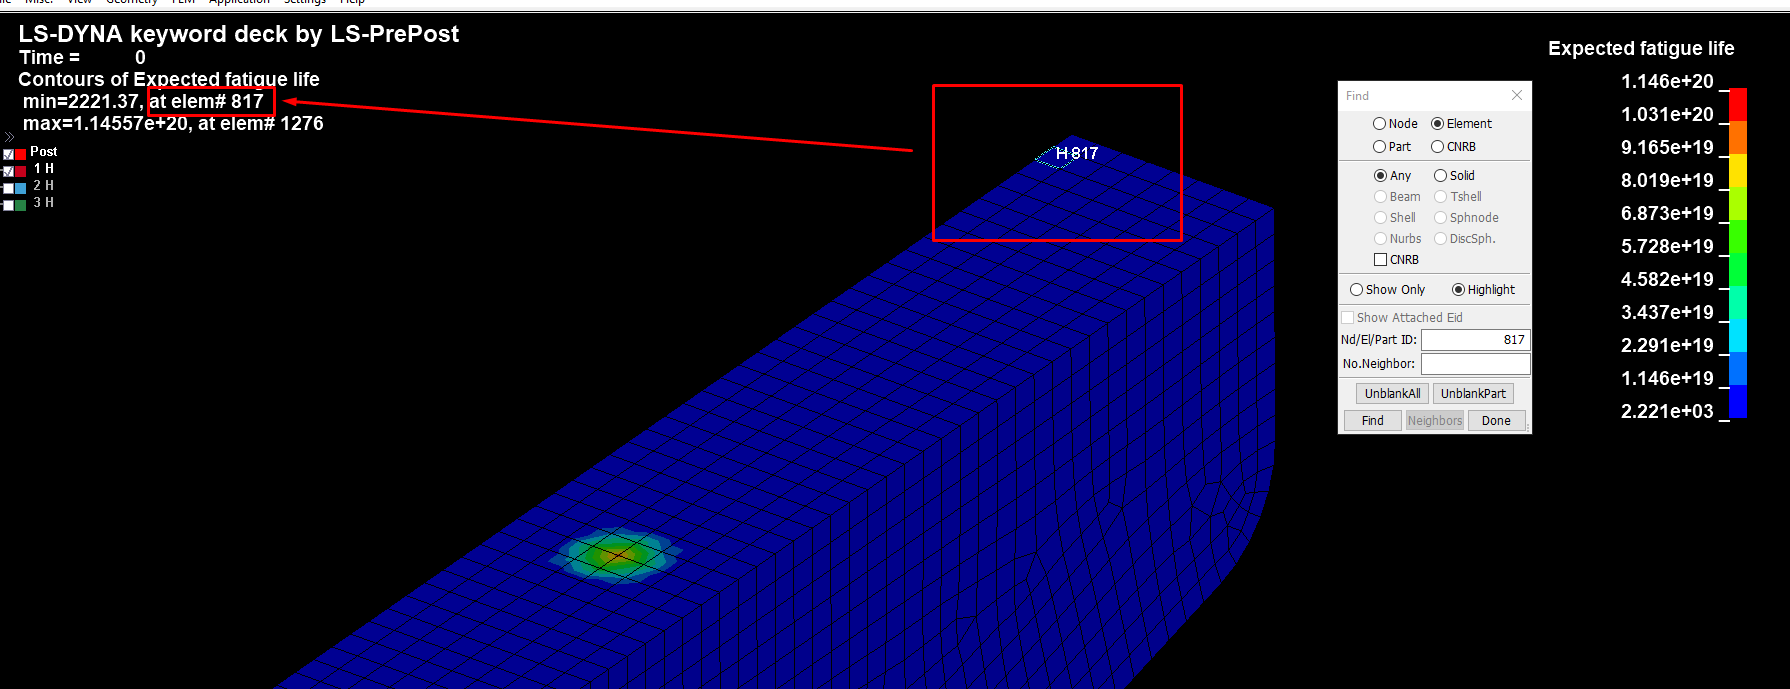
Hello, how do the element stress results compare to the S-N curve? Do the elements showing low fatigue life have higher stresses/high damage ratio?
- Sir, I have modified and simplified the SN curve for the test in this way, from the tensile strength of the material:
Mises stress:
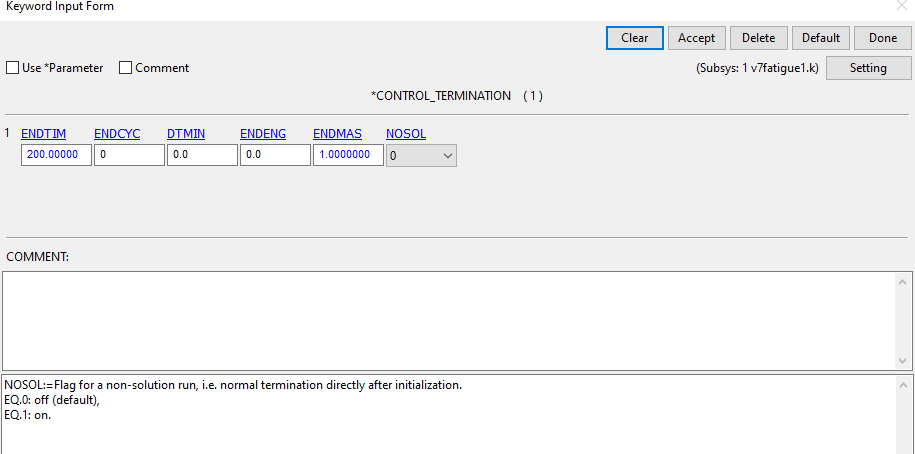
*CONTROL_TERMINATION, also see texpo parameter
- Sir, there is no such parameter
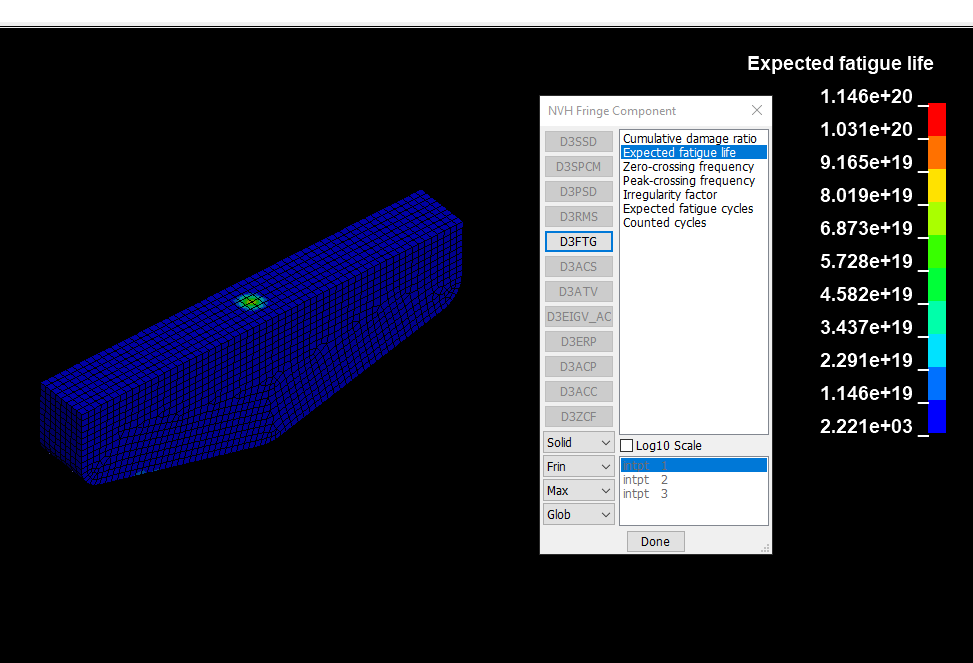
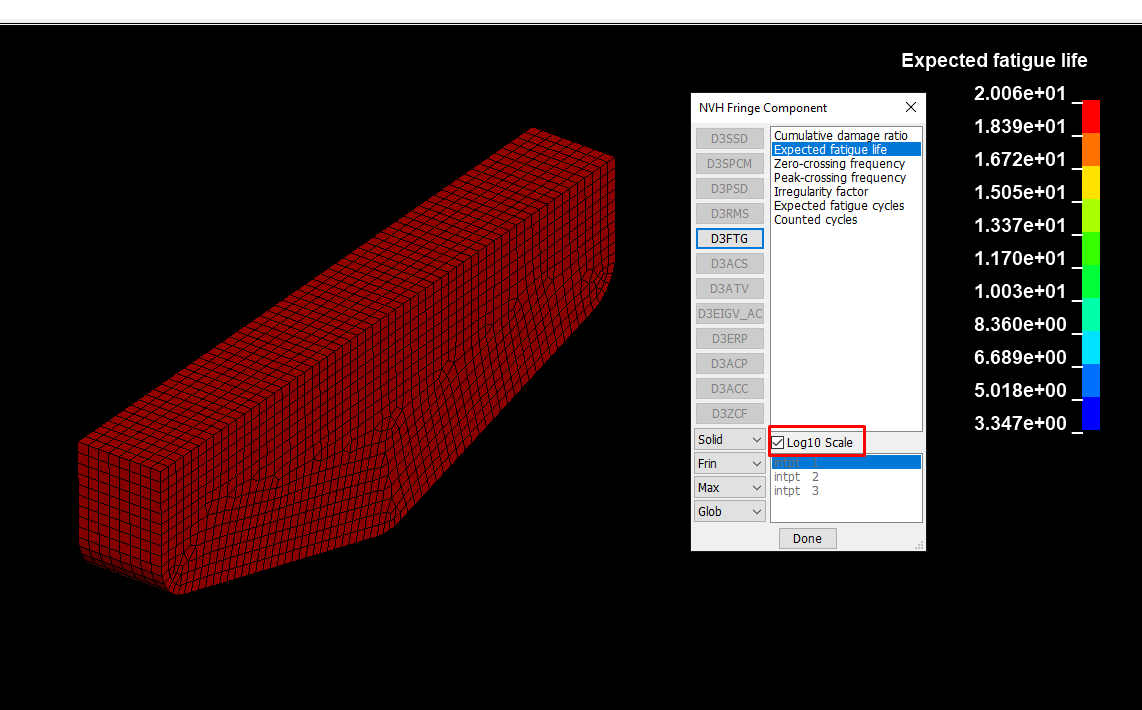
Regarding your question 3, expected fatigue cycles are computed as “expected fatigue life” times “zero-crossing frequency with positive slope”. For d3ftg generated in a time domain fatigue analysis, only cumulative damage ratio and expected fatigue life are provided. There is no “zero-crossing frequency” so no “expected fatigue cycle” is provided.
- I understand sir, there will be no cycles. How then can I check the load, for example, for a task I will drill 10 mm, but I need to check the strength at 1000, how can I scale this? what maps or settings?
___
PS
Maybe I can upload a K-file here? Can you watch it?


