Ansys Learning Forum › Forums › Installation and Licensing › Ansys Products › Loading same .xy files to XY Plot but plotting a different curve in Fluent? › Reply To: Loading same .xy files to XY Plot but plotting a different curve in Fluent?
Hi Rob,
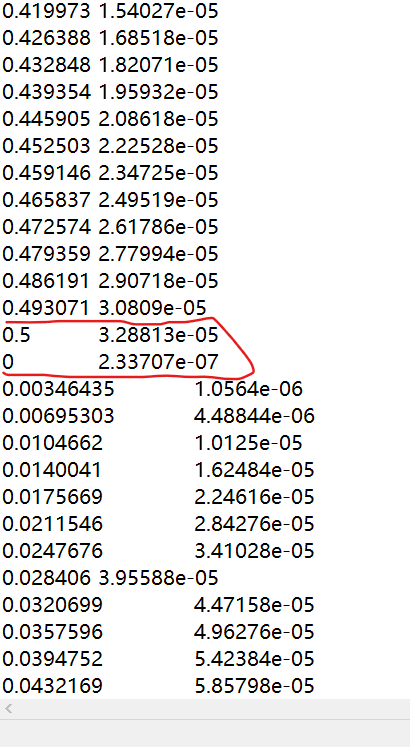
I figured it out but there's still existing problems. I found out that data of x function in exported .xy file aren't arranged in order. Data is separated into two group arranging in ascending order. As you can see below.
I guess the algorithm of Fluent to plot xy plot is that it reads data and plots curve at the same time. When it have read data of 0.5, it would read data of 0 next. Accordingly, the curves was closed. I copied data into Excel and arranged them in ascending order. Then I pasted them back to .xy file and reloaded into flunent. It works.
I'm still confued. Is it a bug? It seems that we cannot load origin .xy files into Fluent to plot simply. And this problem is seldom mentioned. Would Fluent repair the matter in future version?
Again thanks you Expert.


