Ansys Learning Forum › Forums › Discuss Simulation › Photonics › Question regarding the auto shut off in FDTD simulation. › Reply To: Question regarding the auto shut off in FDTD simulation.
Hi Amrita,
Thank you for the confirmation.
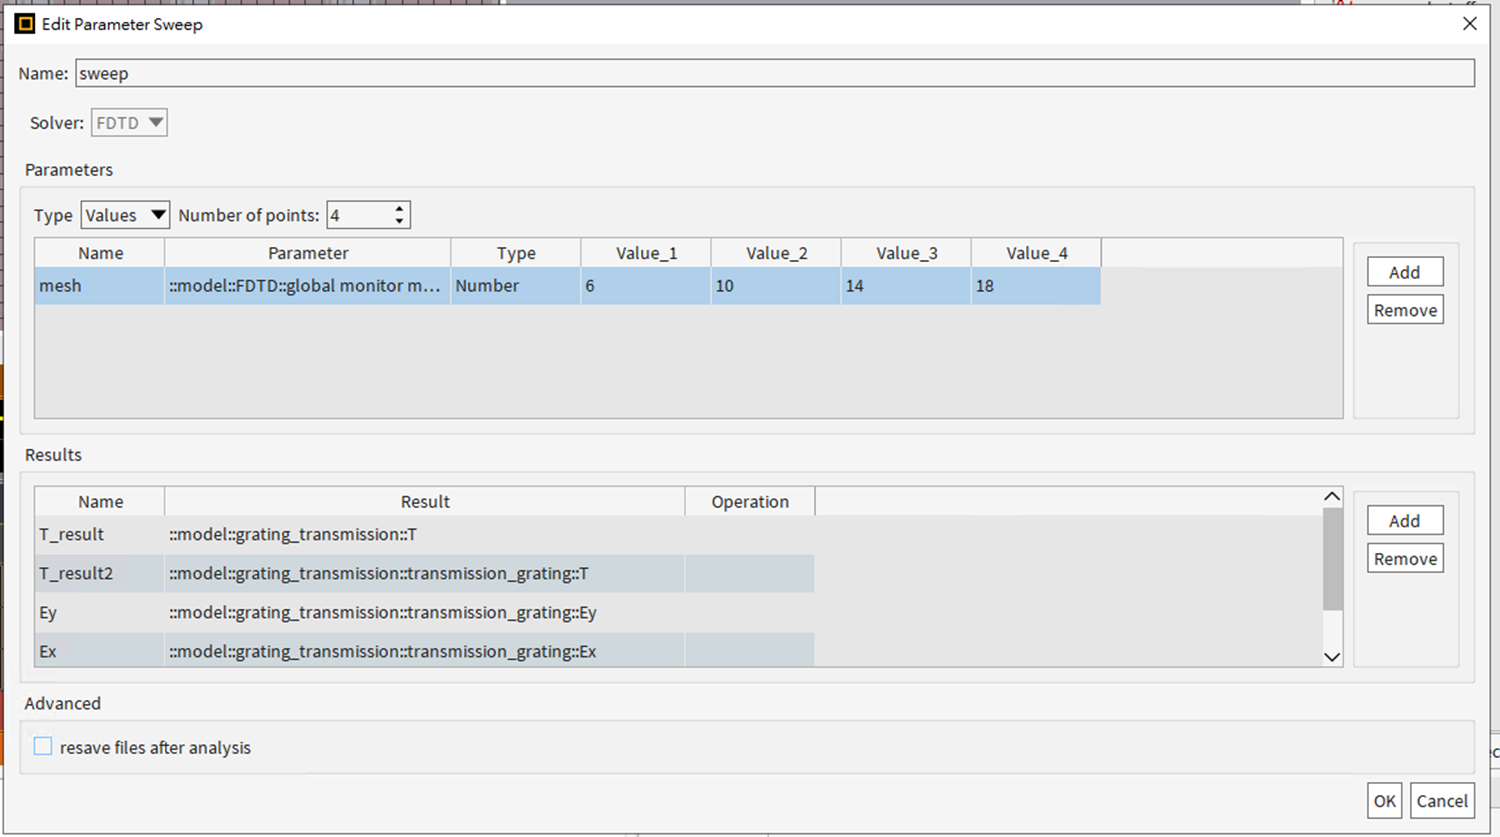
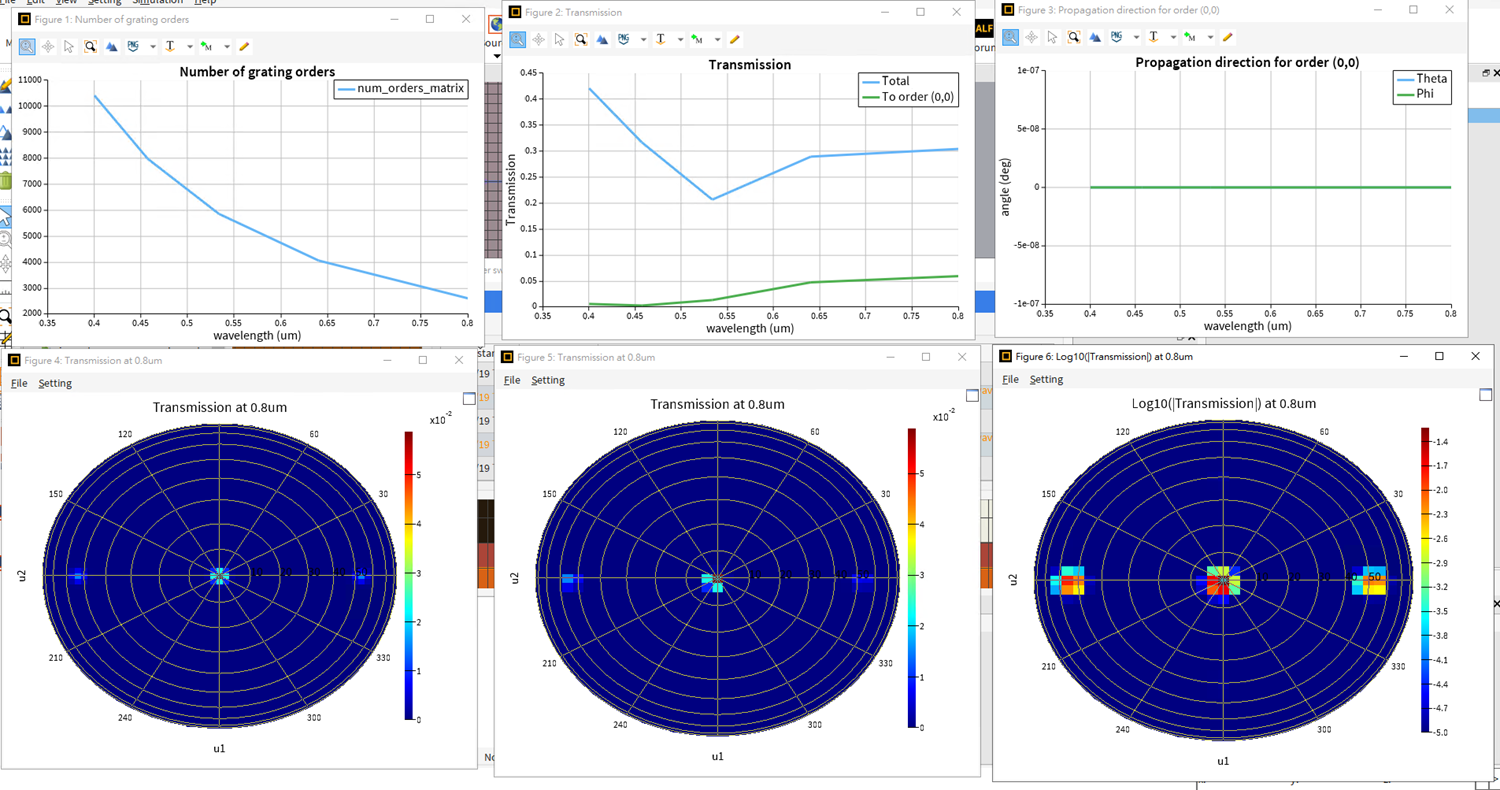
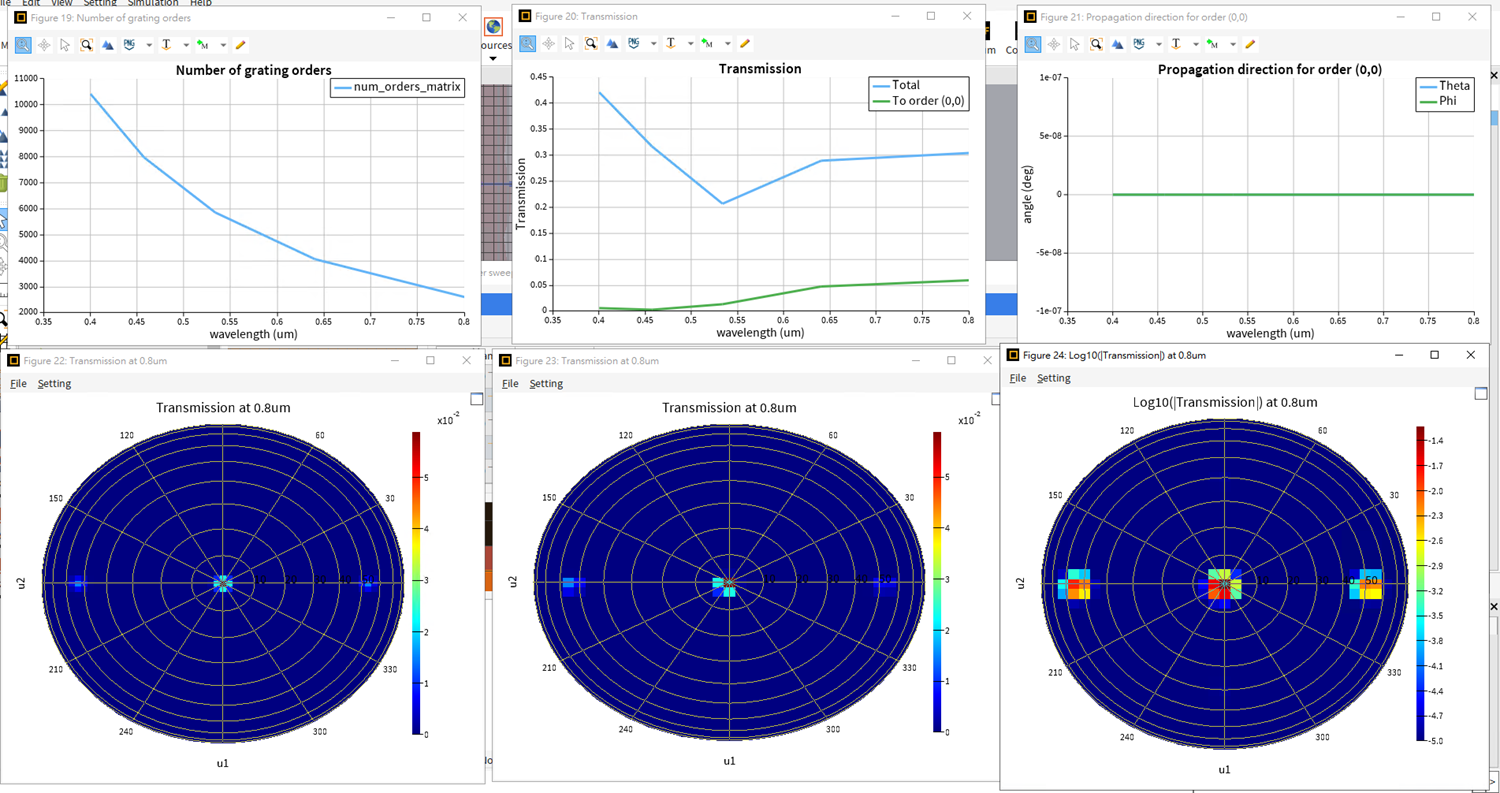
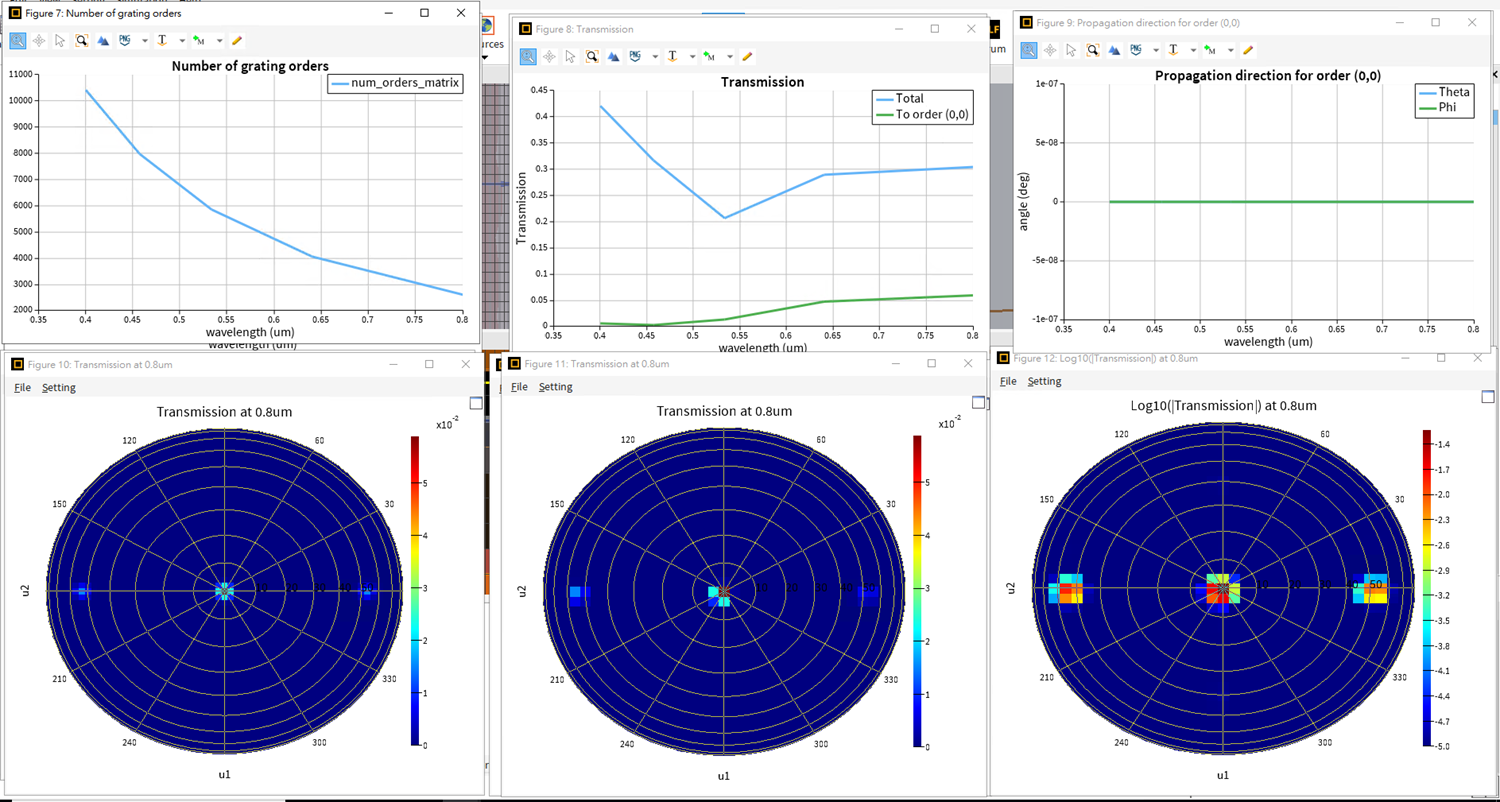
I attempted to run a broadband simulation for 0.4 to 0.8 micrometers using mesh cells per wavelength at 6, 10, 14, and 18. I did not change the auto shutoff level for this simulation and continued to use the default auto shutoff value, which is 1e-05.
Below are the results of the simulation:
- Mesh cell 6:
2. Mesh cell 10:
3. Mesh cell 14:
4. Mesh cell 18:
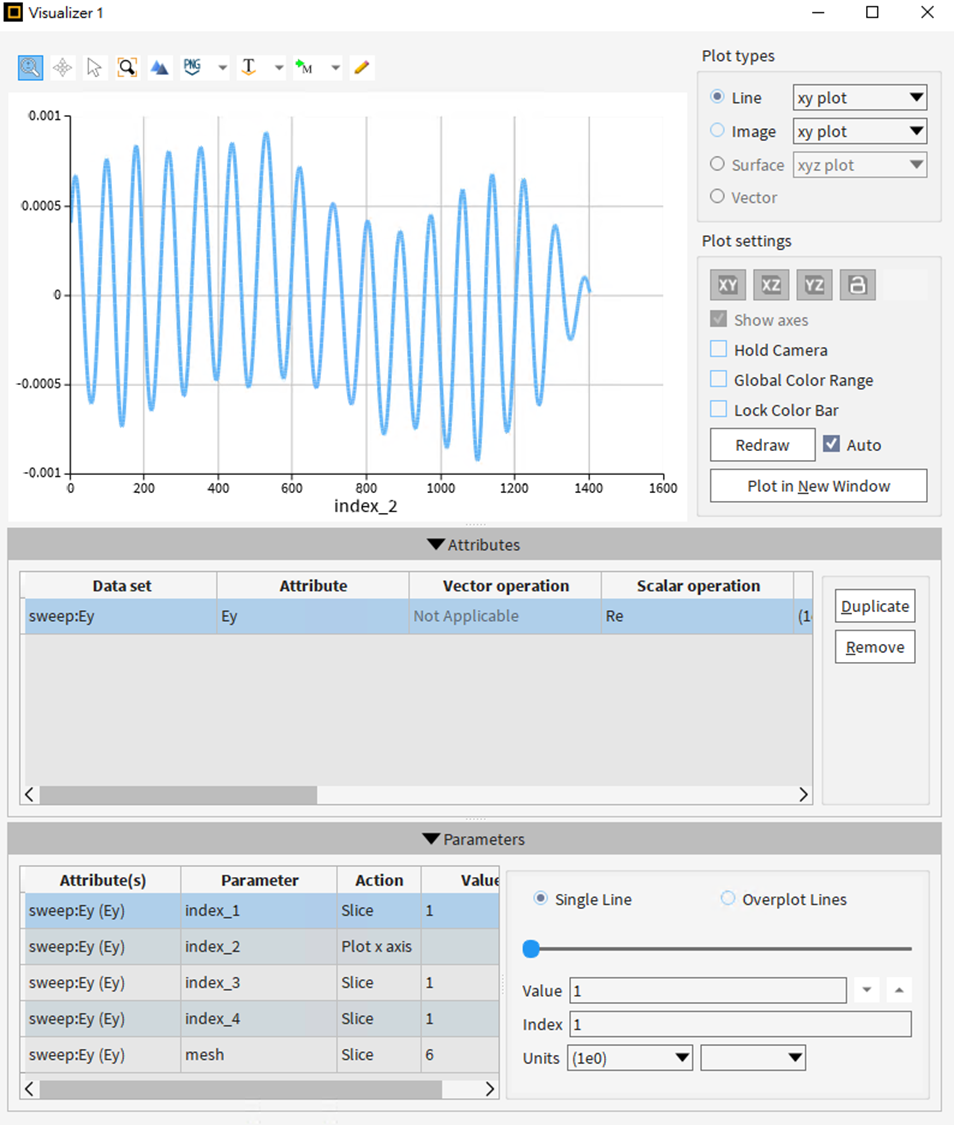
I also tried to capture the Ey here:
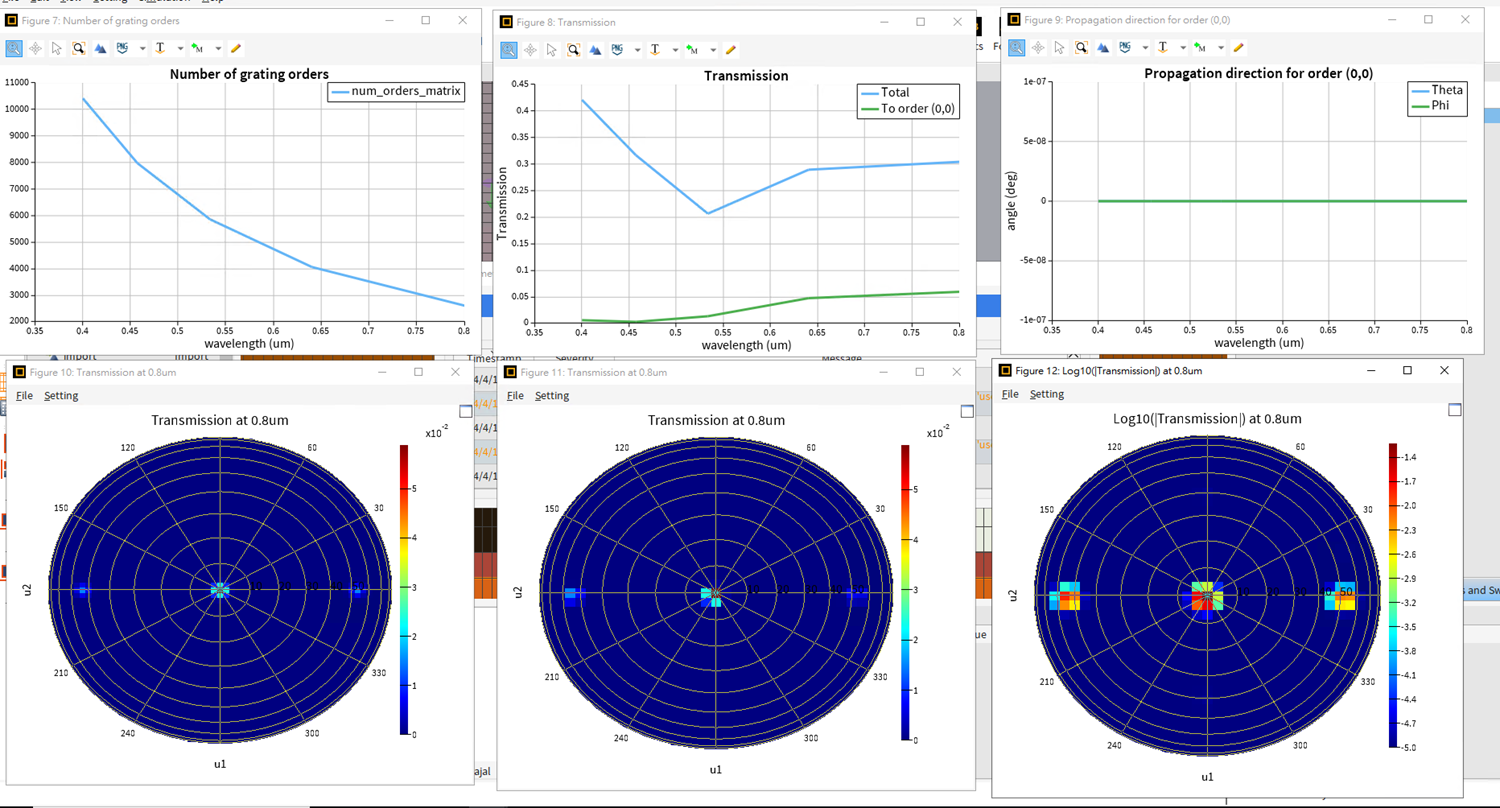
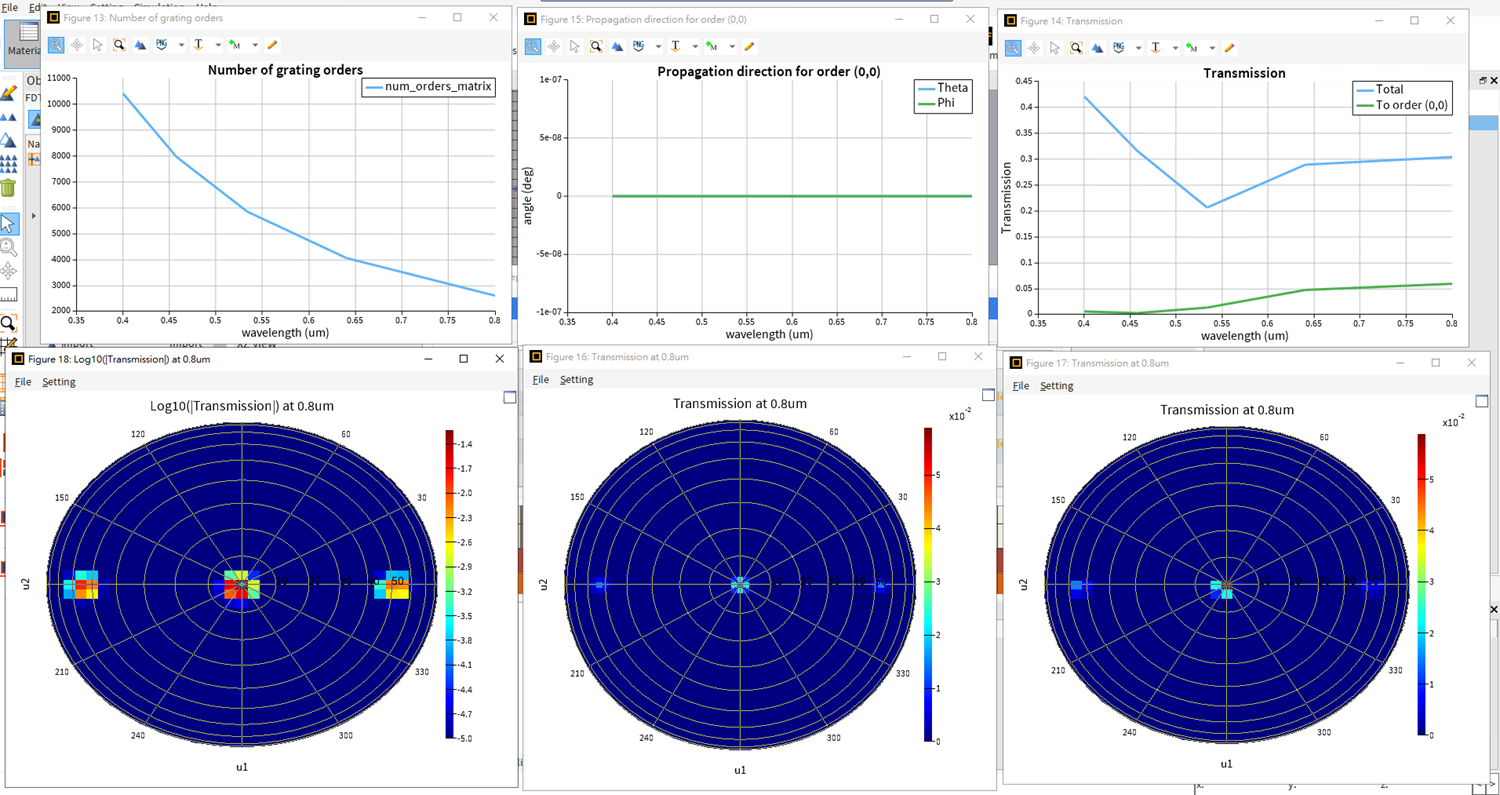
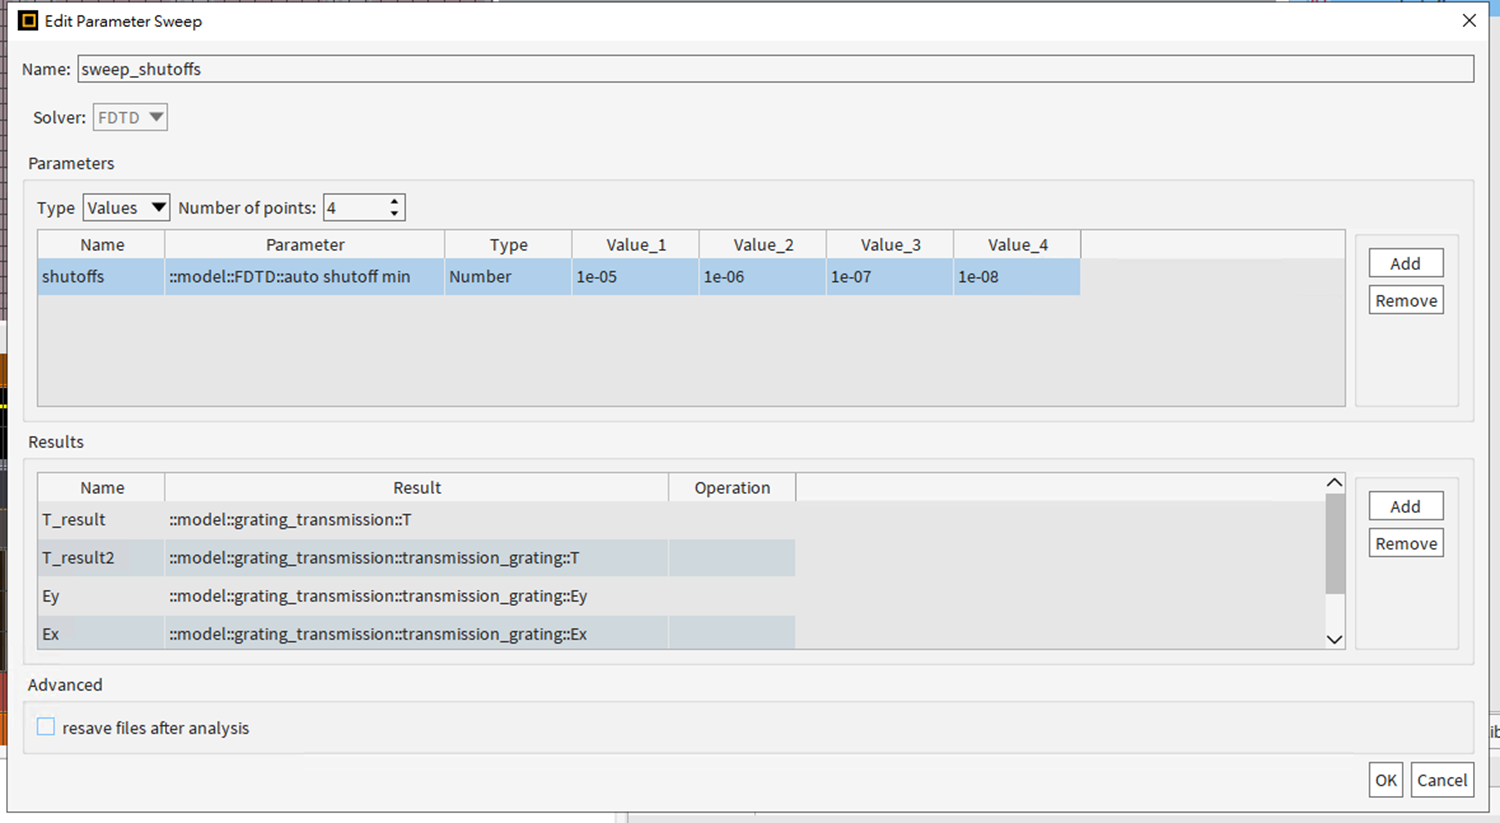
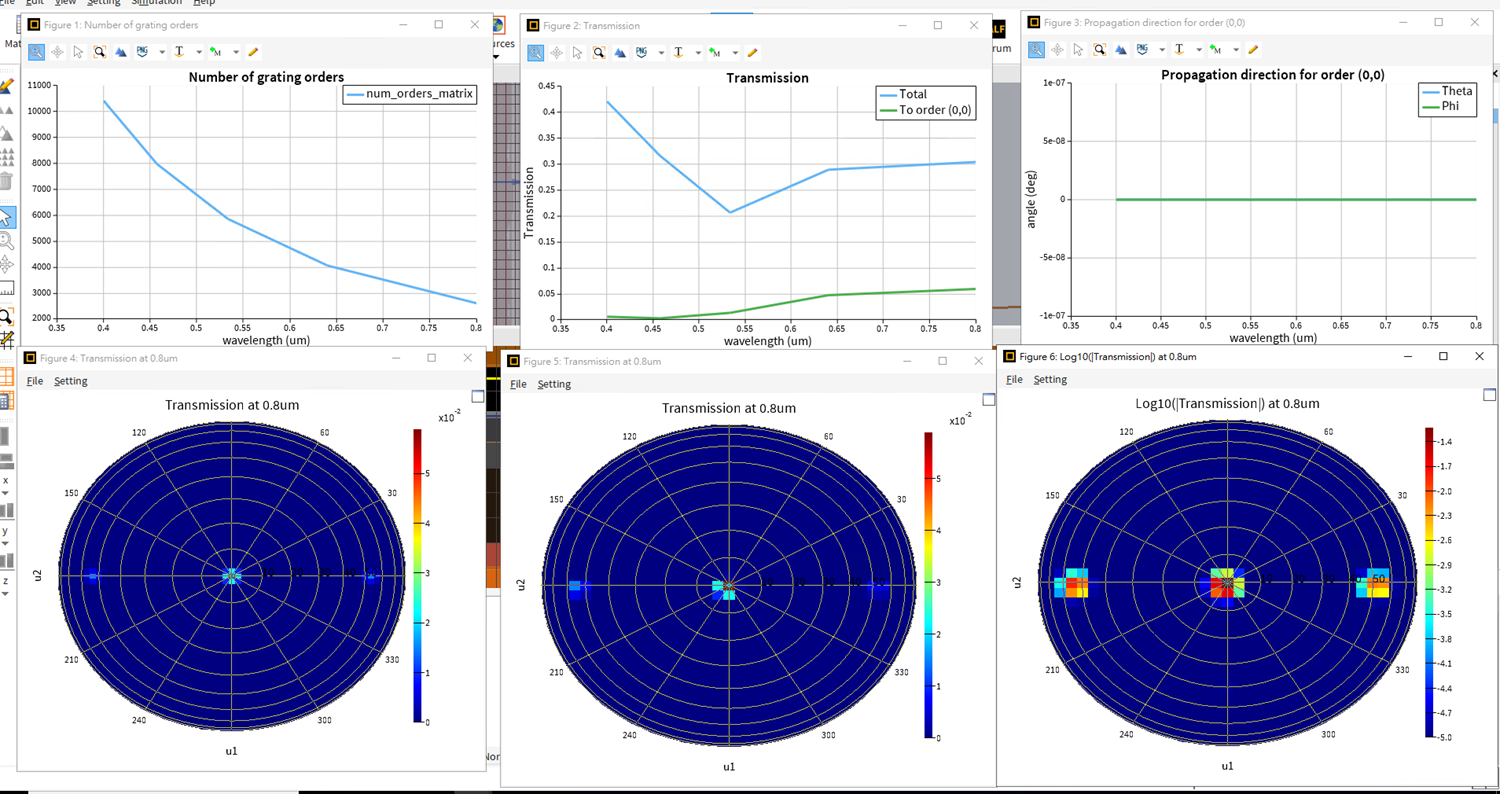
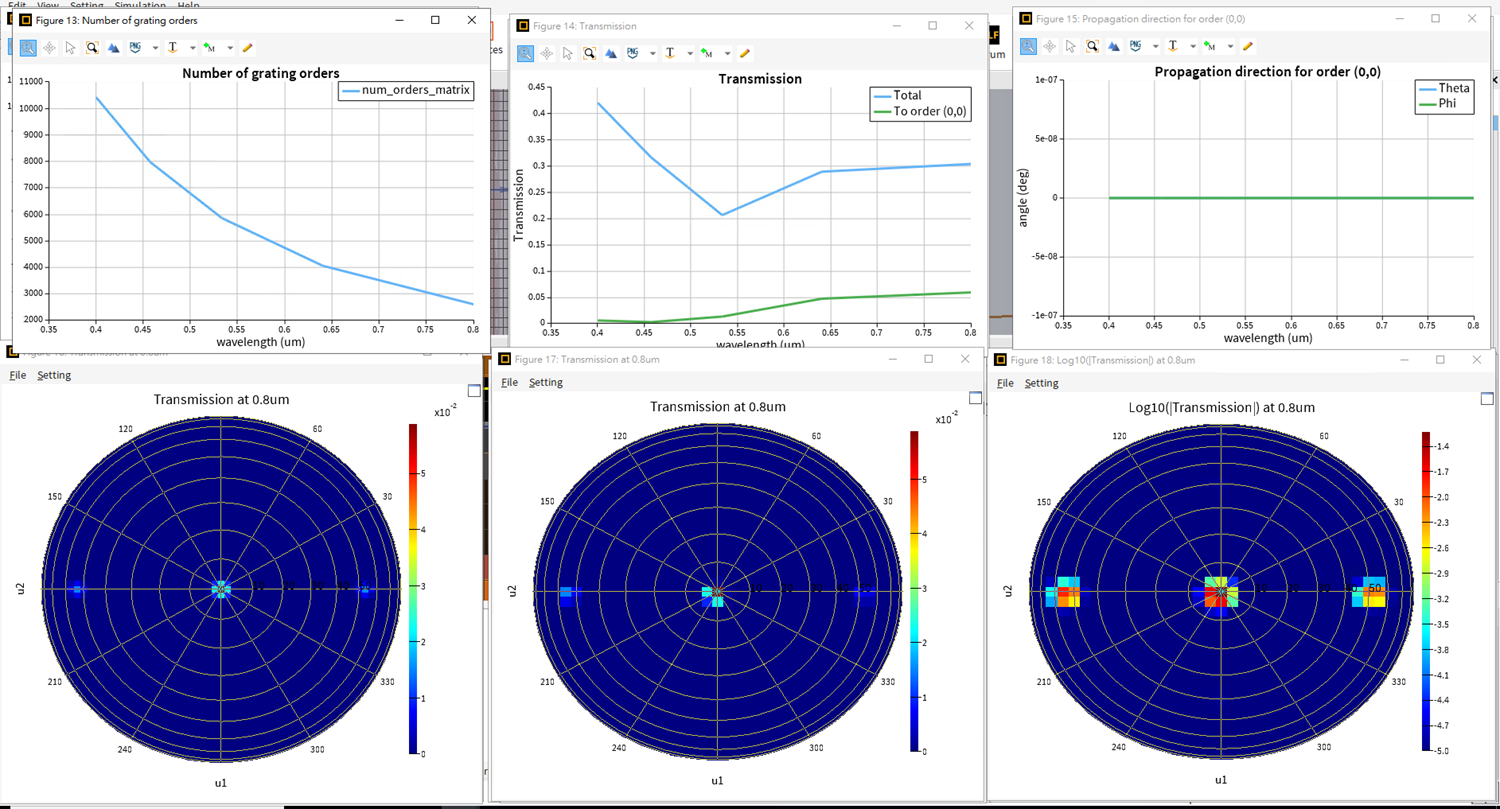
Furthermore, I ran simulations using a broadband spectrum (0.4 to 0.8 micrometers) with different auto shutoff levels: 1e-05, 1e-06, 1e-07, and 1e-08.
Below are the results of those simulations:
- Auto shutoff 1e-05:
2. Auto shutoff 1e-06:
3. Auto shutoff 1e-07:
4. Auto shutoff 1e-08:
The number of gratings, transmission, and propagation orders are almost the same for the results from different mesh cells per wavelength.
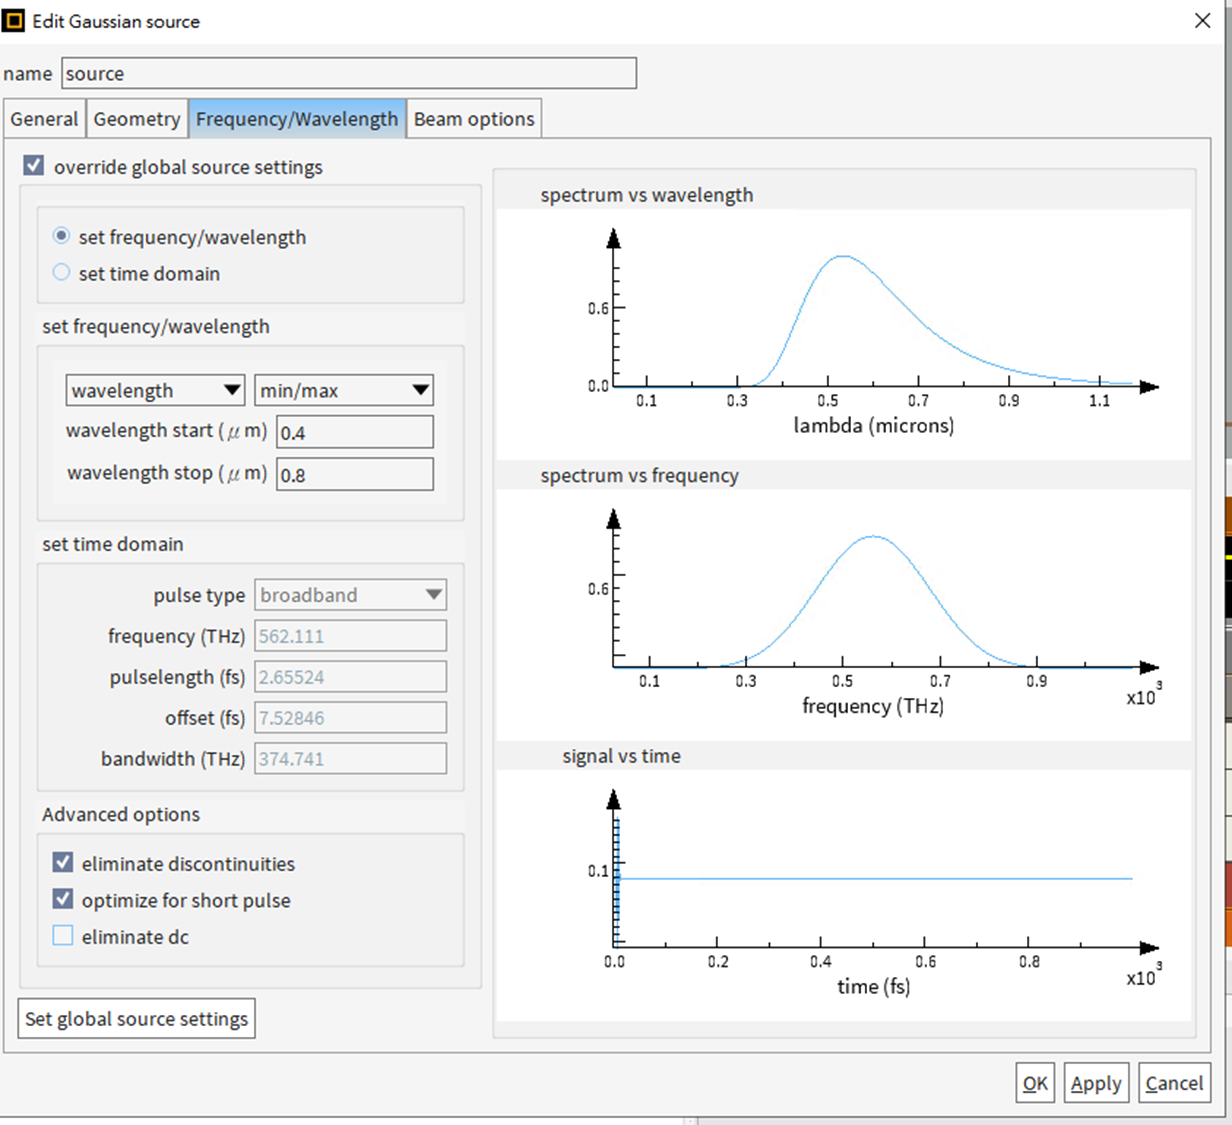
For the broadband spectrum, I am assuming that the distribution of the light source's spectrum is normal, based on Guilin Sun's explanation provided in the Ansys Forum.
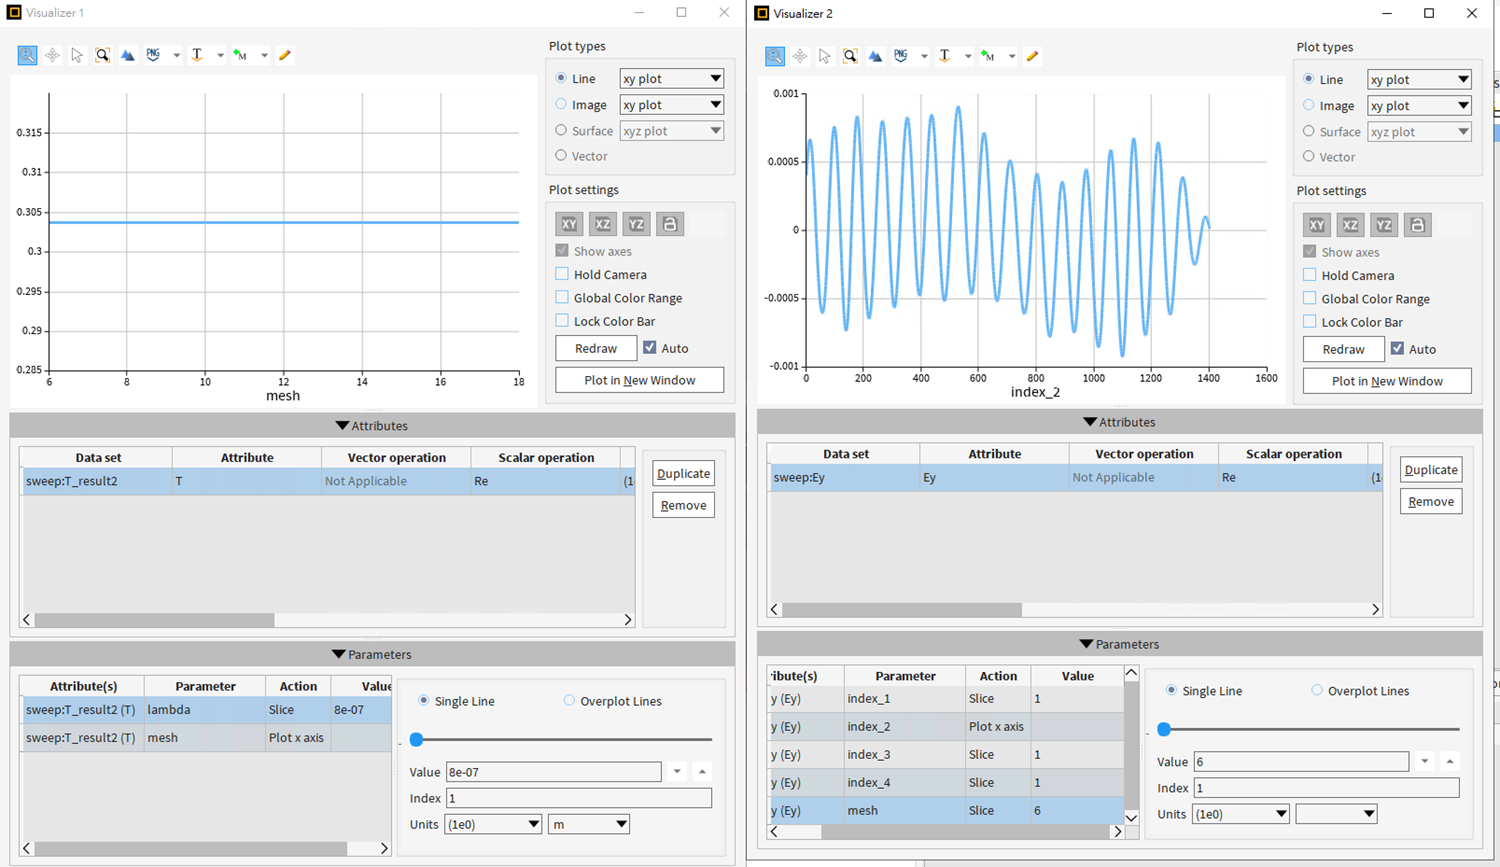
I also obtained the results for T and Ey from the sweep.
For mesh cells per wavelength, the results are the same from mesh 6 to 18.
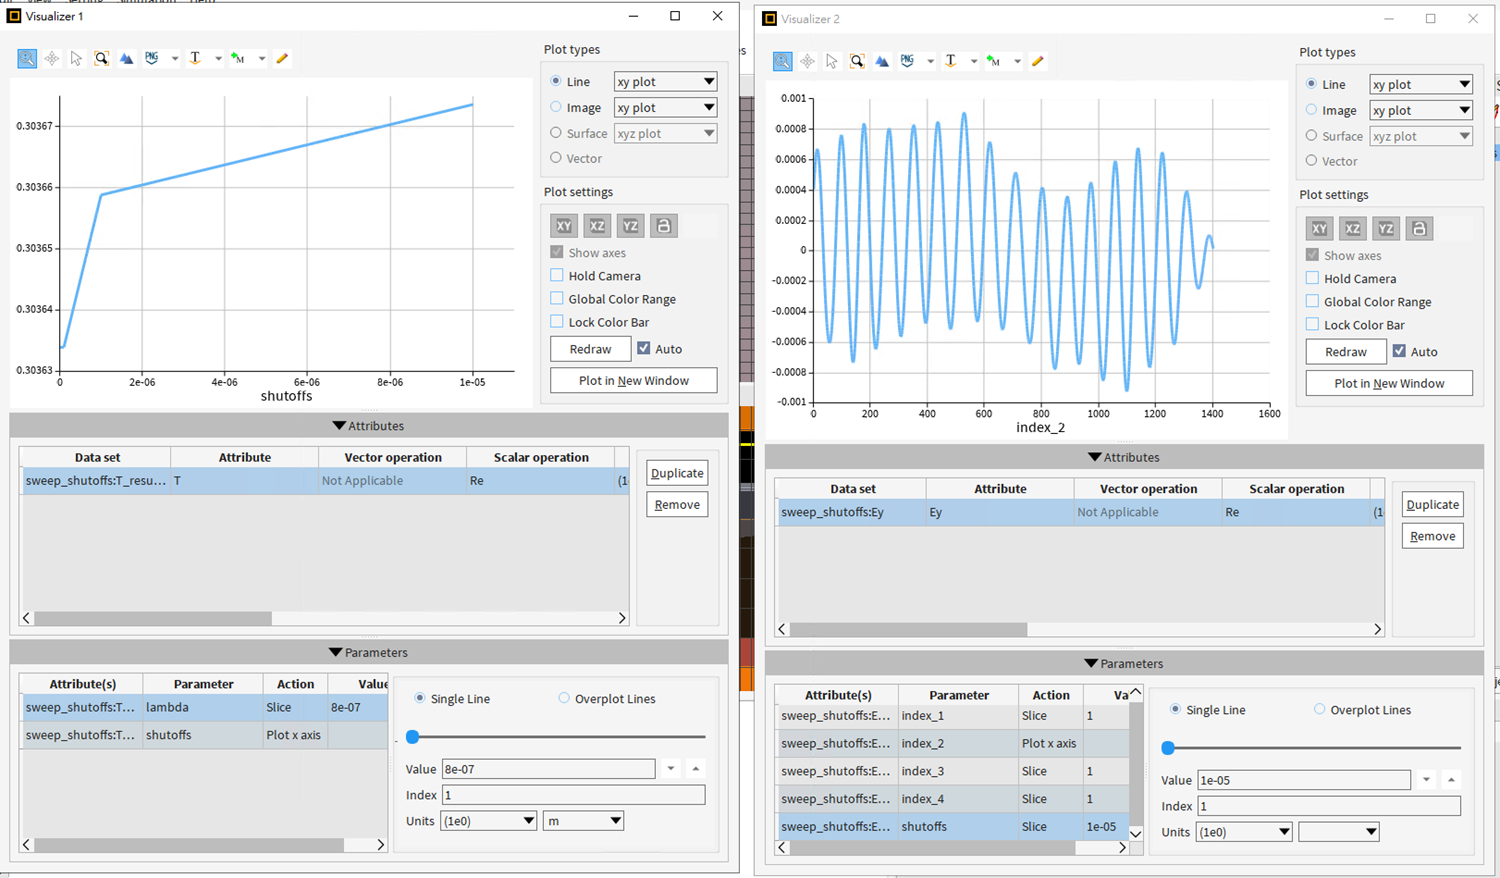
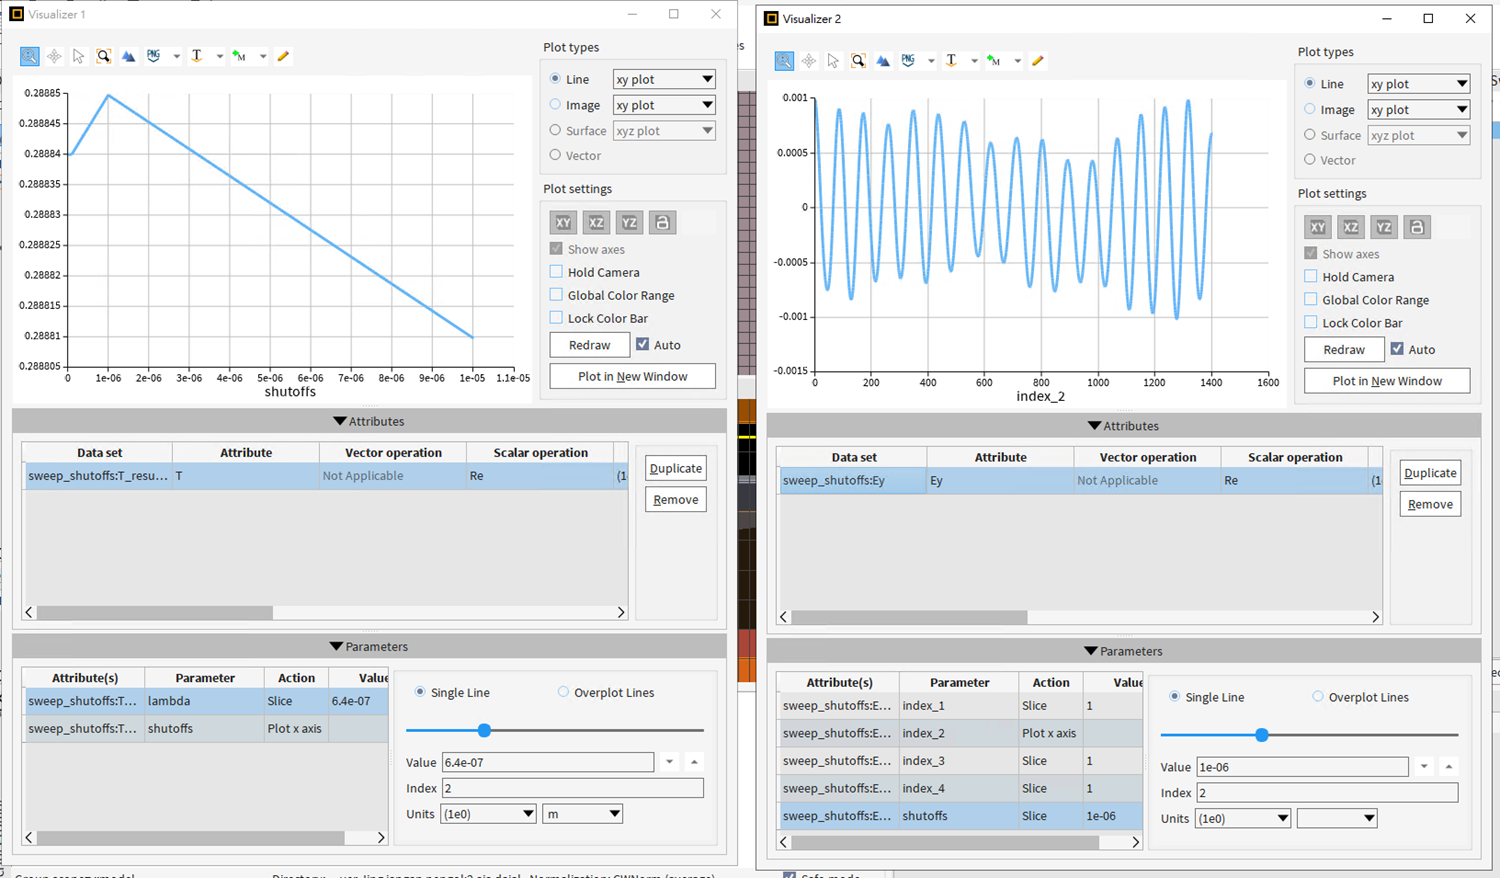
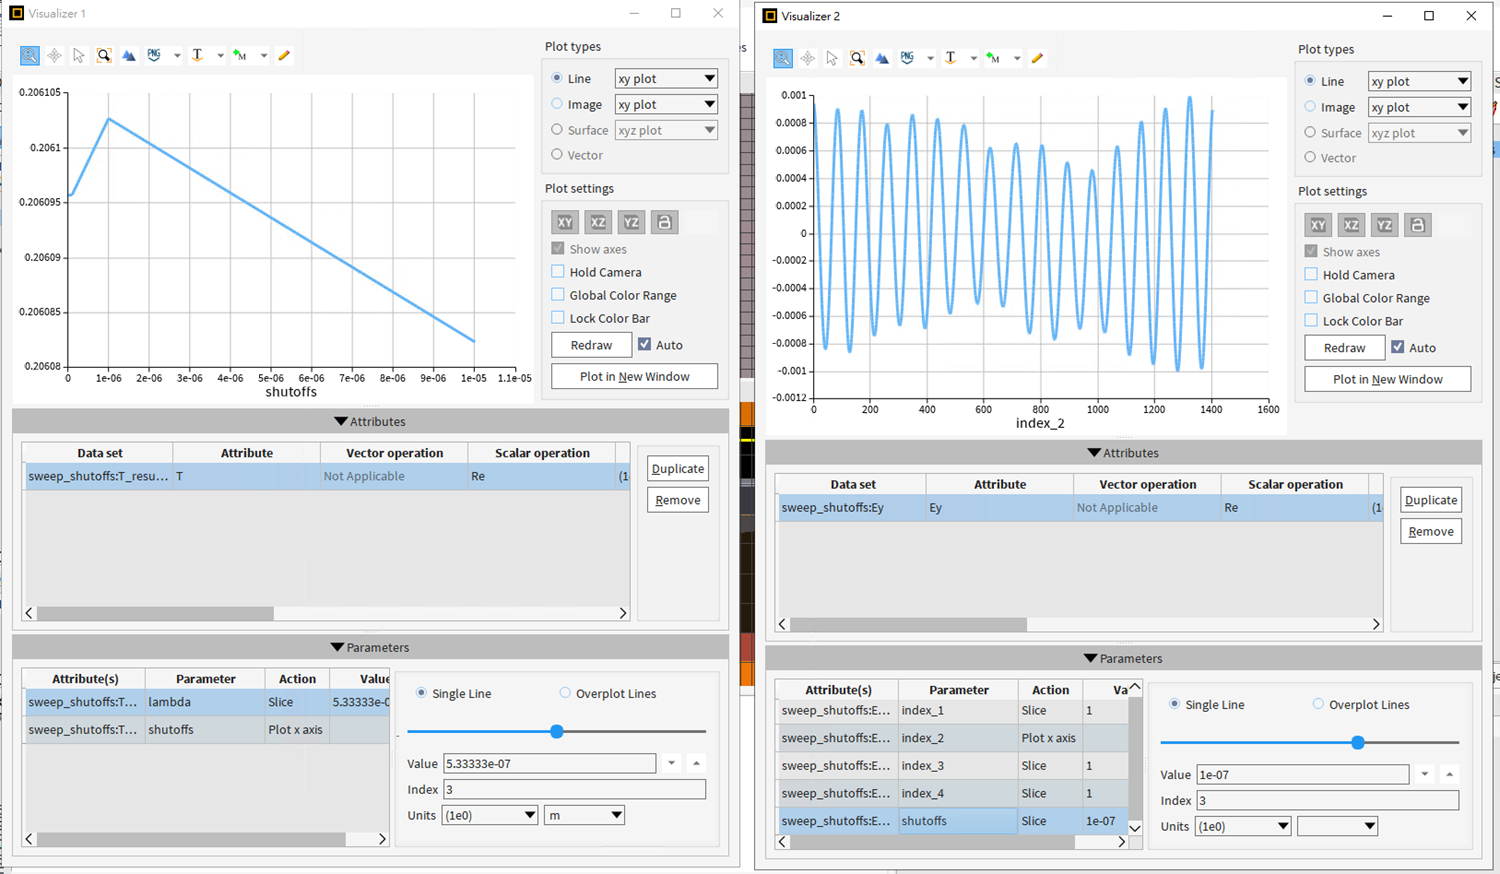
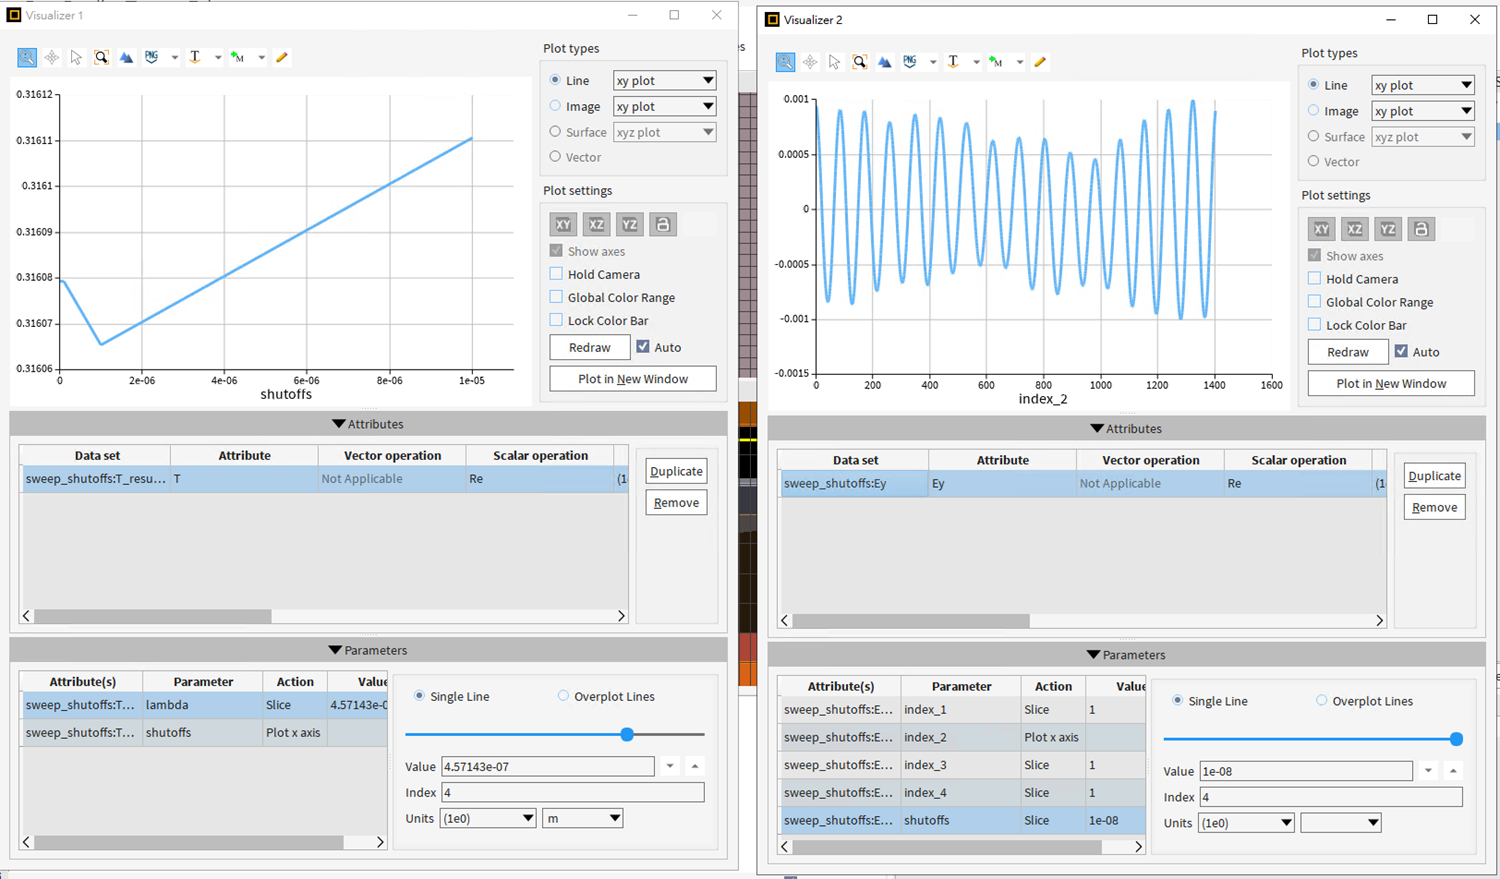
For the auto shutoff settings from 1e-05 to 1e-08, the results are slightly different for each parameter, as shown below:
a. T (lambda: 8e-07) and Ey (shutoff: 1e-05)
b. T (lambda: 6.4e-07) and Ey (shutoff: 1e-06)
c. T (lambda: 5.33e-07) and Ey (shutoff: 1e-07)
d. T (lambda: 4.571e-07) and Ey (shutoff: 1e-08)
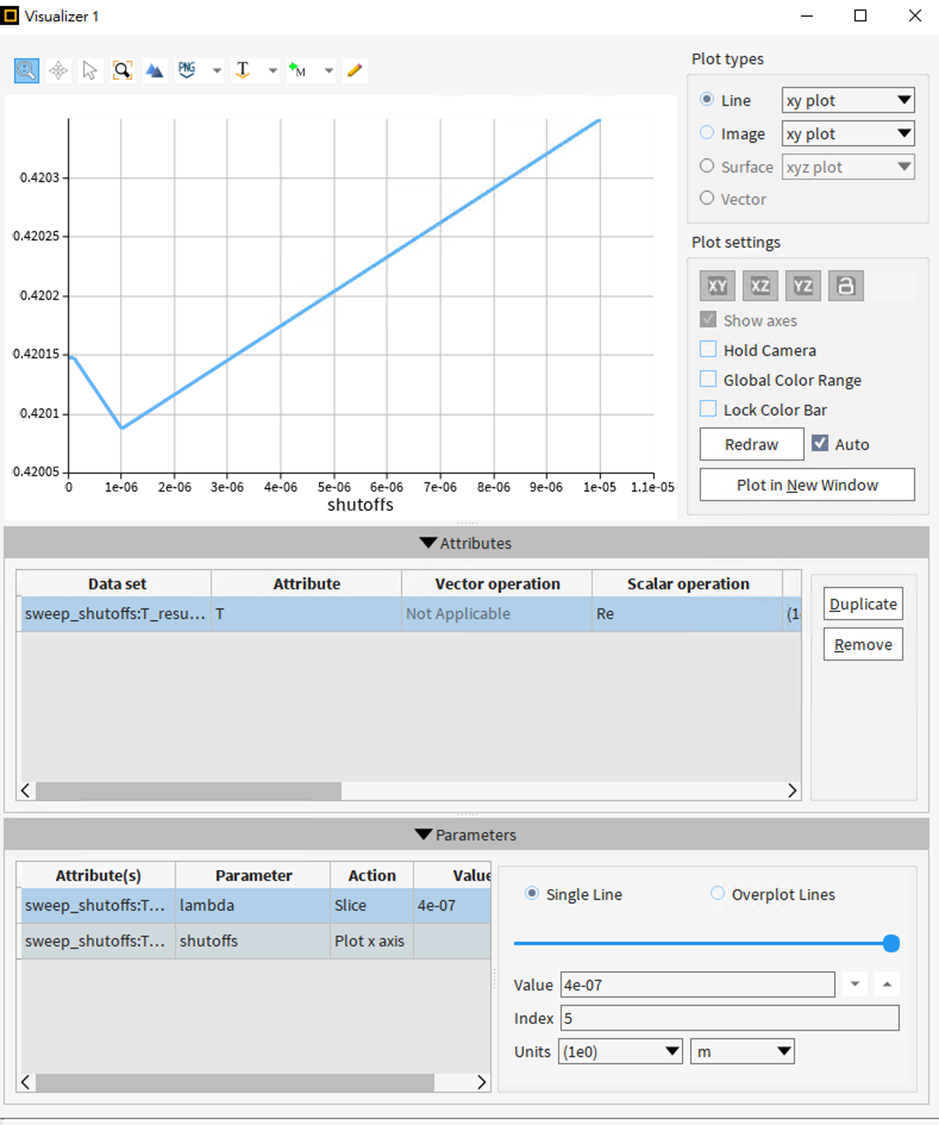
e. Lambda 4e-07
The results for T sometimes decrease and sometimes increase. Is this normal?
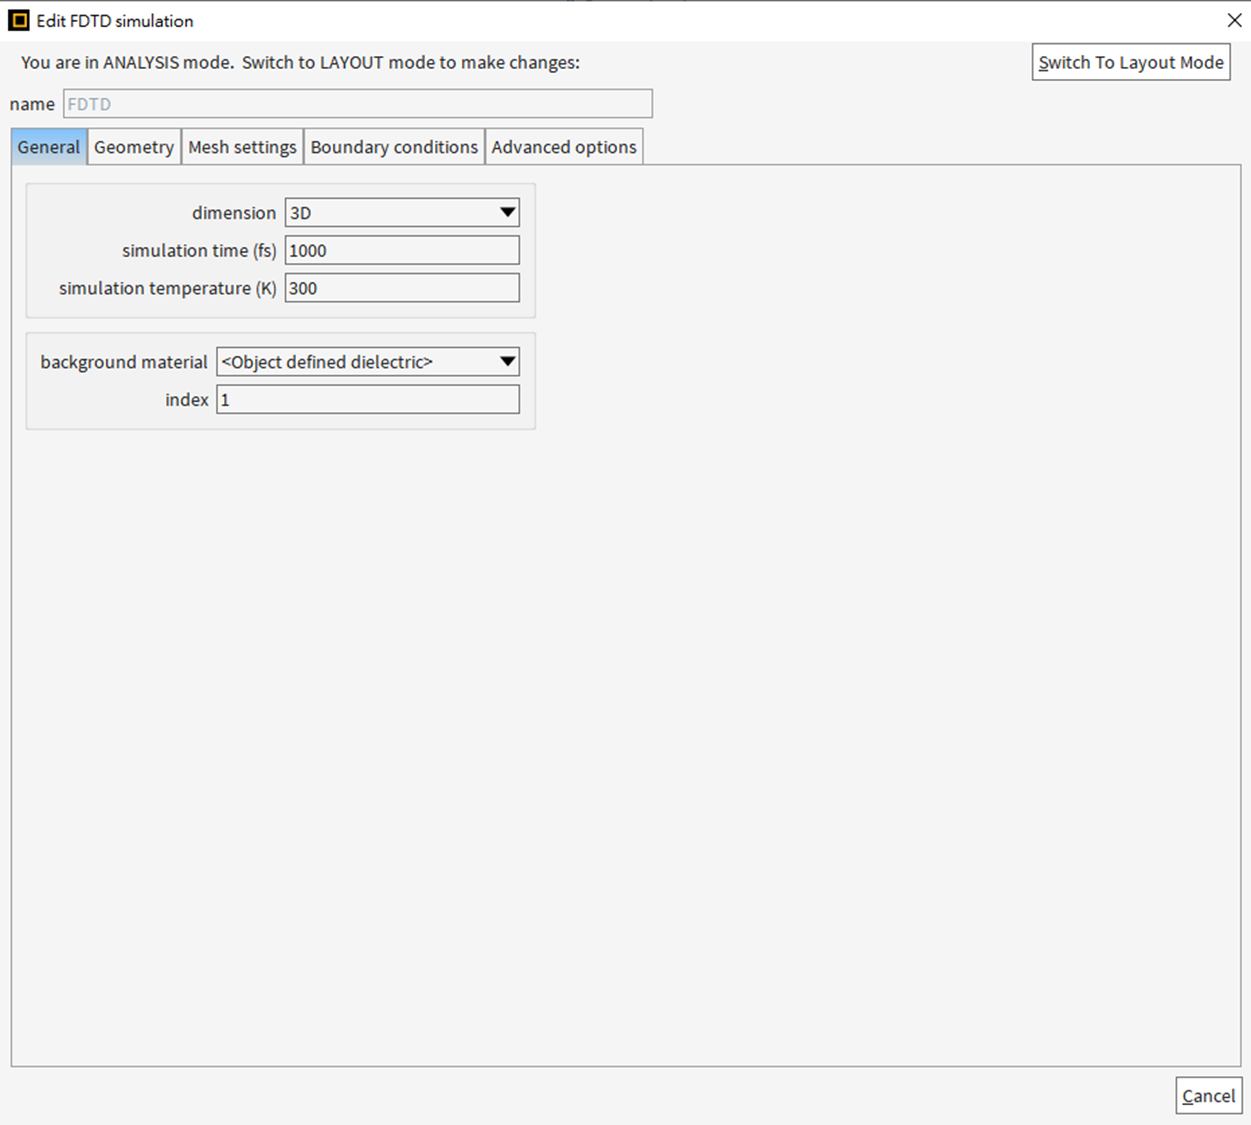
Regarding the Ey, some oscillations are present, but can we assume they indicate very high or poor results? (The simulation time was 1000fs, which is the default.)
From these results, does my simulation seem convergent enough to you? Or is there anything concerning about the results or my settings?
Best regards,
Miller.
