Ansys Learning Forum › Forums › Discuss Simulation › Photonics › Regarding box of monitors and far field simulations › Reply To: Regarding box of monitors and far field simulations
Hi Prabha,
The differences could be because of several factors. The size of the monitor will strongly influence the result as it dictates how much of the power is collected. If there is significant radiation at the edges of the monitor, there will additional effects due to diffraction at the edges of the monitor which will also affect the farfield results. You might have to make the monitor extremely large which might end up taking a lot of time to run the simulation. The position of the monitor could also be a bit tricky and has to be addressed on a case by case basis. I also wouldn't recommend placing the monitor at/very close to the interface as some of the results would be interpolated from below the interface and some from above depending upon the exact location of the monitor in the Yee cell/mesh cell. In conclusion, both these parameters would require convergence testing to finalize their exact values.
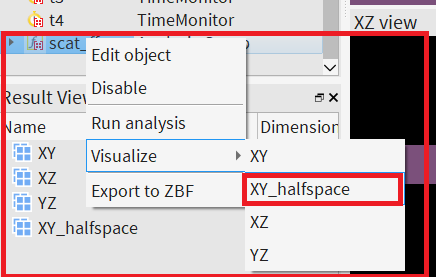
These challenges are addressed by box monitors. At the beginning, I thought it would be complicated to change the current analysis group to give the expected result. But then I realized that we could use another analysis group called "scat_ff" which can be found as "Far field from a closed box" in the Object Library. Although it says that the box is not supposed to be used with a substrate, we can delete/disable the monitor in the substrate (z1) as we are already not interested in the radiation in the -z direction in the LED example (using 5 monitors). We can set the postion and span of the "scat_ff" monitor same as the previous "farfield" analysis group. Then we can run and visualize the XY_halfspace result to look at the polar plot of the farfield:

The subscripts of the XY_halfspace result indicate upper or lower halfspace. E is the field and E2 is the intensity. One thing to note here would be that unlike the previous analysis group, this one calculates the farfield for all frequency points as opposed to a single target frequency. So, if you run the analysis with the current simulation setup, it would be time consuming. I would recommend changing the dipole wavelength to a single wavelength (you could use 0.625 which is the target wavelength in the example) and then running the analysis group as a starting point to save time. I would also recommend increasing the resolution of the farfield plot by changing the corresponding parameter in the analysis group, the default resolution is rather low:
Feel free to let me know what are your thoughts.
Regards,
Amrita


