Ansys Learning Forum › Forums › Discuss Simulation › Photonics › Regarding box of monitors and far field simulations › Reply To: Regarding box of monitors and far field simulations
Thank you for the reply. I have a question related to the placement of a single z-normal monitor. I have placed a monitor(35x35x0.17um) exactly on the top of the structure(on the surface closer to the dipole source). I have made the simulation region larger(25x25x2um). And why I am getting different polar plots if i placed the monitor a little far from the structure surface and far from dipole source. How did i know which plot is correct?
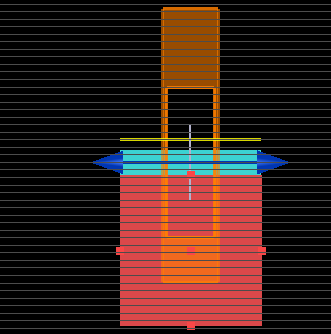
1) Close to the source/on the surface(blue colour thin film)
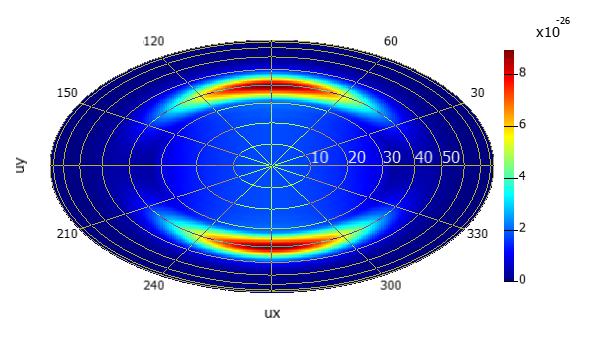
Here monitor(Z2) is placed on the top/surface of thin film.(blue layer). And I got the following polar plot.'
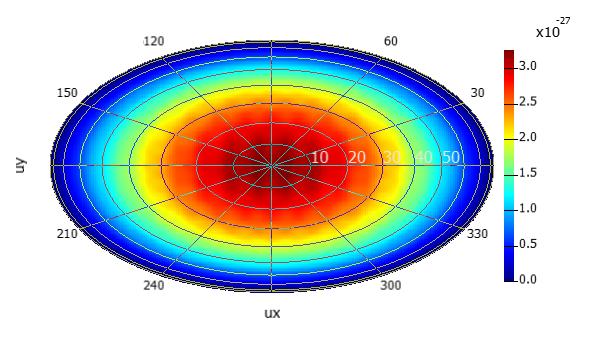
But when I place the monitor at a height/a little bit away from the surface of the sample.
I got the following spectrum
So, i dont understand why I am getting two different patterns? and which one should i take as the more accurate plot?
.png)


