Ansys Learning Forum › Forums › Discuss Simulation › Photonics › How to output TimeMonitor result by using script › Reply To: How to output TimeMonitor result by using script
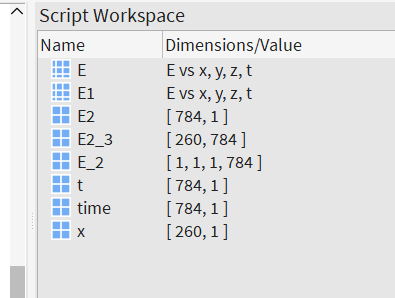
You have already got E2 the intensity, which is a 4D matrix: xyz and time.
You can use “pinch” to remove the singleton dimension. pinch – Script command
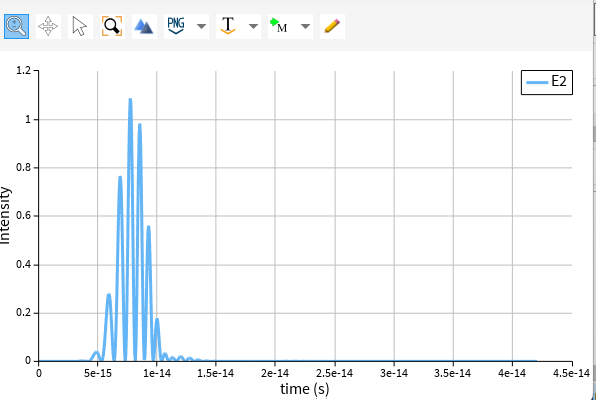
if you are using a point time monitor, after “pinch”, it will be a 1D matrix, which is the time.
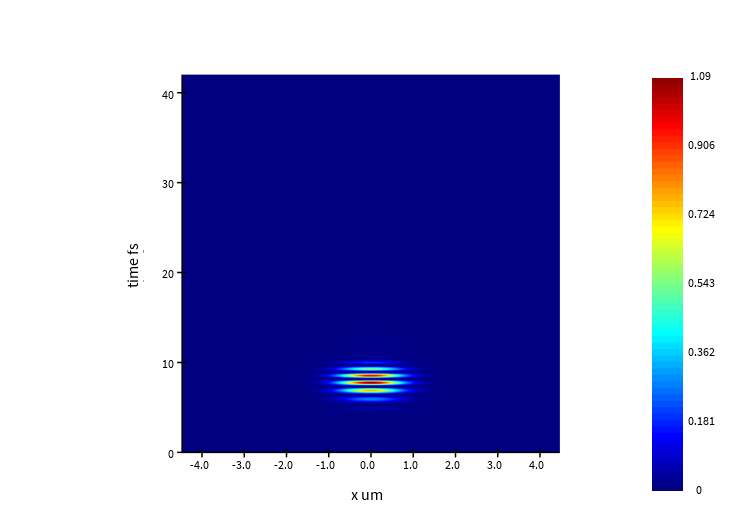
If you use a line time monitor, the result will be 2D.
E = getresult(“monitor_1″,”E”);
E_2=E.E2;
E2=pinch(E_2);
time=E.t;
plot(time, E2,”time (s)”,”Intensity”);
E1 = getresult(“monitor_3″,”E”);
E2_3=pinch(E1.E2);
x=E1.x;
t=E1.t;
image(x*1e6,t*1e15,E2_3,”x um”,”time fs”);
you can save the result in ldf format: savedata – Script command
or matlab format: matlabsave – Script command
txt format: write – Script command
As for the data, you can simply save the dataset, which will be easy for you later, or each of the data matrix, eg, E2,x,t etc.


