Ansys Learning Forum › Forums › Discuss Simulation › Optics › Optimizing EO Effect: Analyzing Static E-Field Distribution › Reply To: Optimizing EO Effect: Analyzing Static E-Field Distribution
 gcharalampous
Thank you, Guillin, for the fast reply. That was the function I was missing. I do have one last question.
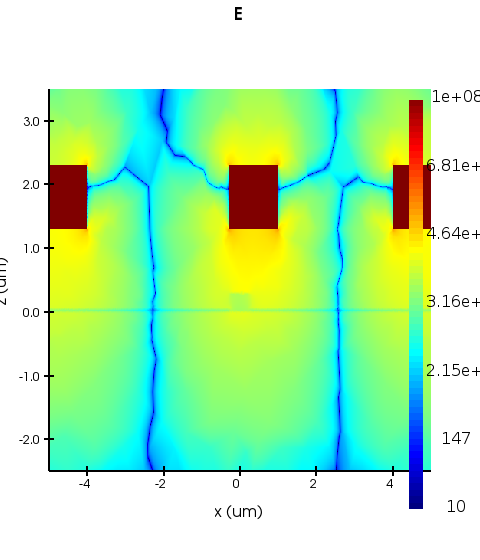
I believe I have successfully interpolated the E-field from the 1-D triangular grid to the rectilinear 2-D grid. This is the interpolated E-field:
And this is the E-field I can visualize from the Lumerical 2D data visualizer:
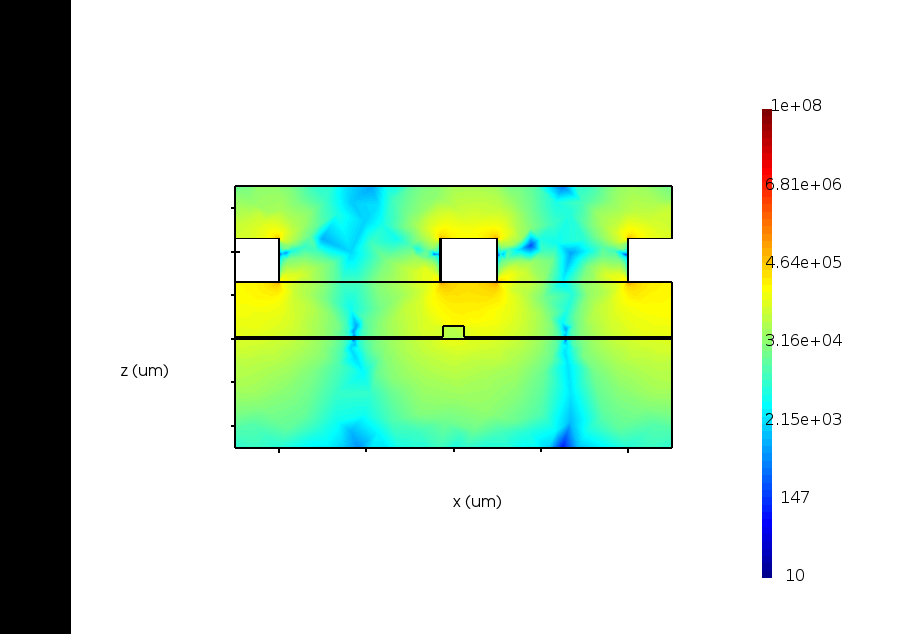
I believe the two plots look quite similar. I understand they differ in terms of grid size, number of points, scale, etc. However, the main difference I notice is that in the interpolated plot, the E-field appears infinite inside the metal conductors. In the Lumerical plot from the visualizer, the E-field is zero in the metal conductor. The E-field should be zero inside the conductor according to Ohm’s law. Is it a numerical error coming from the interptri script command function?


