Ansys Learning Forum › Forums › Discuss Simulation › Photonics › How to show phase units appropiately? › Reply To: How to show phase units appropiately?
With the shift I was asking about why the drop of the phase in the article occurs at 1200 nm whereas the one I have simulated does the same at early 1300 nm, could you revise the model and give me some advice over it?.
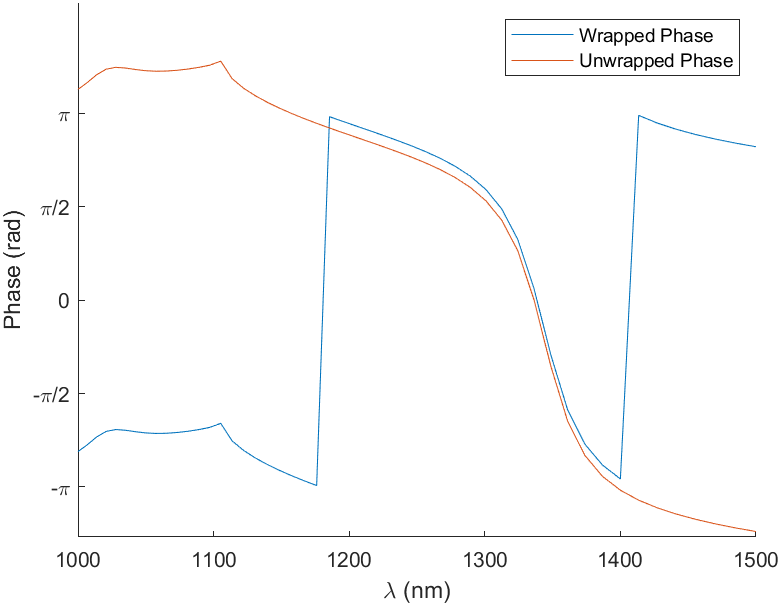
Besides that, I have come into terms about how to represent the phase. Doing what you mentioned about reaching a center frequency, I recovered this phase (which is I guess what I was looking for):
It was implemented in MATLAB following this criteria:
Where 'ang_unw' is defined as the direct unwrap(angle()) that comes from Lumerical's script. I have added both the .lsf and correspondent figures to the dropbox instance in case you wanted to revise them. What is done through this script, is actually correct? Cause at the end, one still has a graph that is not adequately framed over [pi, -pi], but something that is more or less similar to the unwrapped figure centered over the wrapped figure. To be clear, I want to get the same unwrapped figure, but representing the actual physical meaning, which is the same graph but fitted over the correct range.


