Ansys Learning Forum › Forums › Discuss Simulation › Photonics › How to select the simulation time to accurately calculate the Q factor. › Reply To: How to select the simulation time to accurately calculate the Q factor.
 Vahram Voskerchyan
Hi Guilin,
Thanks for your reply. I just swept over the signal and calculated the Q factor at each time and plotted the graph. I think here the best think is to isolate the peaks using the example here:
https://optics.ansys.com/hc/en-us/articles/360041611774-Quality-factor-calculations-for-a-resonant-cavity
But I was just curious why at certain times the Q factor is so high and the other times no and I could trust the value. Using the Gaussian filters to isolate the peaks gives me the Q of ~10e4 which is something I would expect. The signal looks really strong and the simulation time is high so that the signal becomes flat, shown below: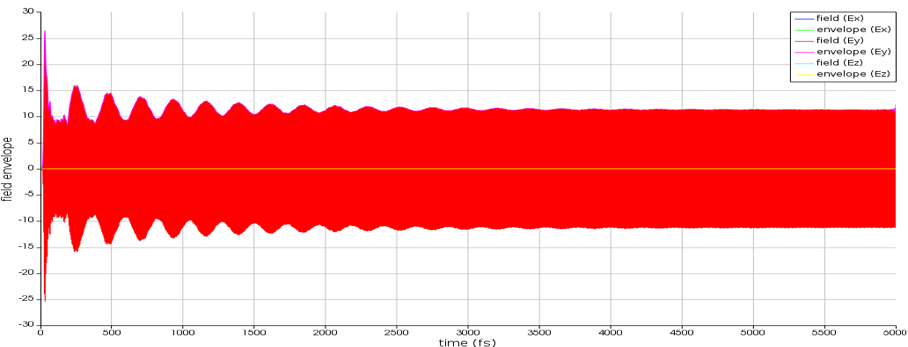
Thank you,
Vahram


