Ansys Learning Forum › Forums › Discuss Simulation › Fluids › XY plot in Ansys fluent 2021 R1 › Reply To: XY plot in Ansys fluent 2021 R1
Hi
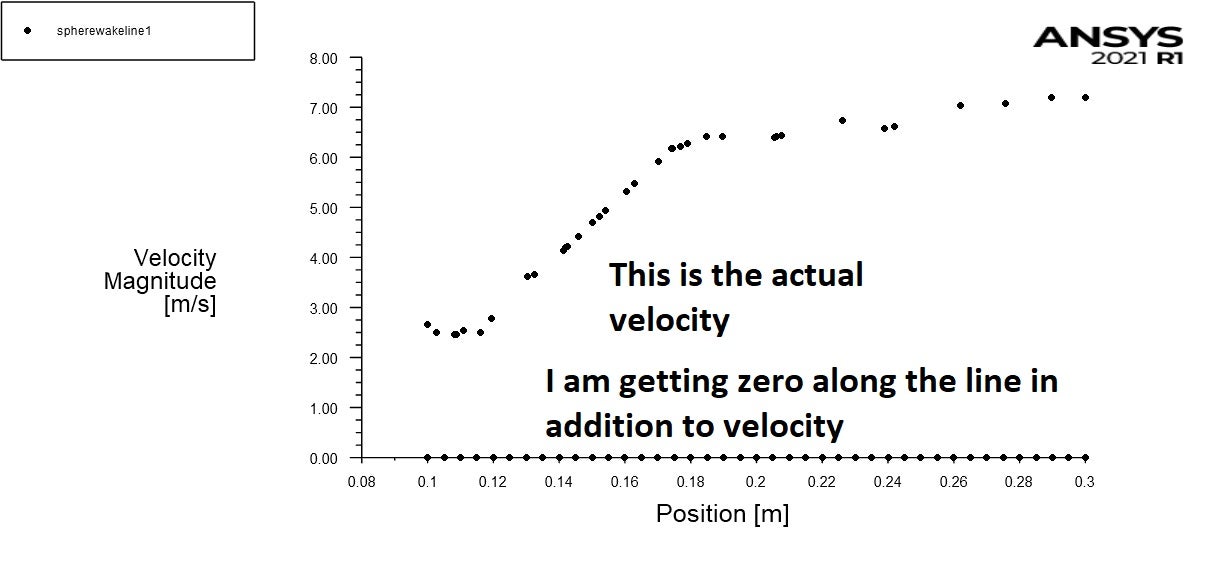
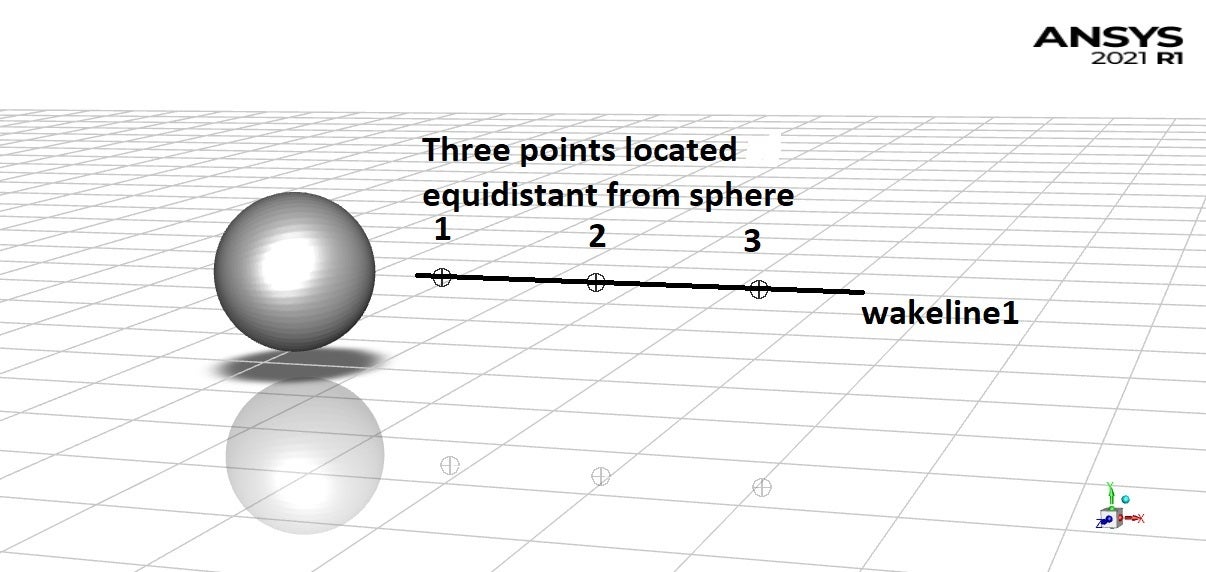
Thanks for taking time to reply. Its not the boundary layer. The velocity values look okay and the drag is about 0.4 which is in accordance with literature for flow past sphere. The vertex average at the points have zero velocity as shown in figure. Even the line has zero velocity along the line and then there is some velocity of wake. Why the velocity is zero? I used Hex Mesh for "Body of Influence". Is this messing up with the results?
I hope the images convey my question. Please let me know where I am possibly going wrong. Each simulation is taking hours to complete and I am not able to get the strouhal number.
Thanks!


