Ansys Learning Forum › Forums › Discuss Simulation › Photonics › How to check the phase of the optical spectral components in Interconnect? › Reply To: How to check the phase of the optical spectral components in Interconnect?
Hi again,
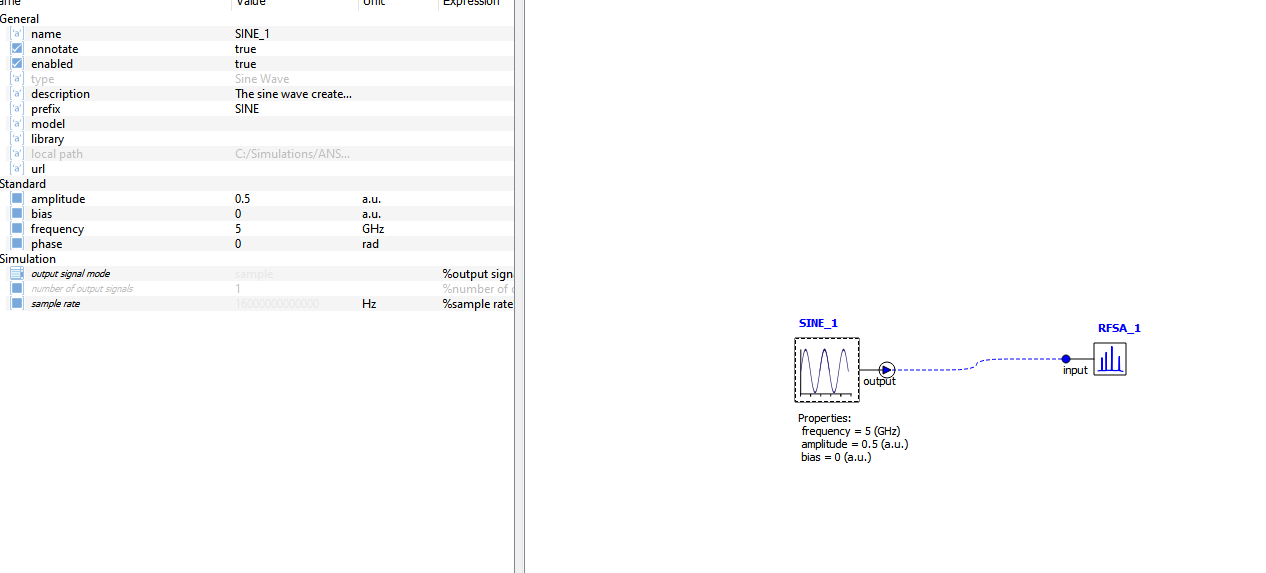
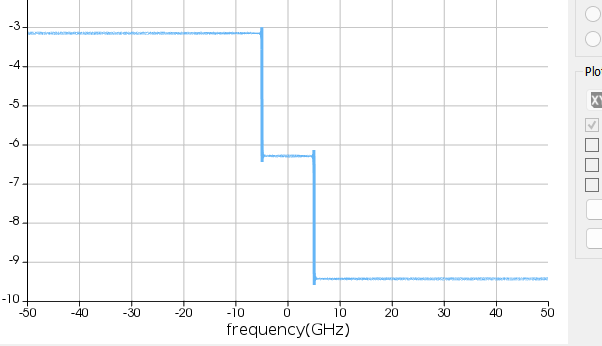
I have a follow up guestion. I do not understand how to interpret the results from the Angle scalar operation and I didn't find any instruction. For example, I have the most simplest possible system: a Sine wave generator, and a Electrical spectrum analyzer. For the spectrum analyzer I use the rectangular plot format and the angle scalar function to plot the phase(?). My initial phase is 0 rad (first results plot), and pi/2 rad (second results plot). Could you please help me with the interpretation of the plots? How can I verify that indeed I see 0 rad, and pi/2 rad on the angle plot?
Kind regards,


