Ansys Learning Forum › Forums › Discuss Simulation › Preprocessing › Data distortion with a non-structured mesh › Reply To: Data distortion with a non-structured mesh
October 4, 2023 at 8:51 am
Subscriber
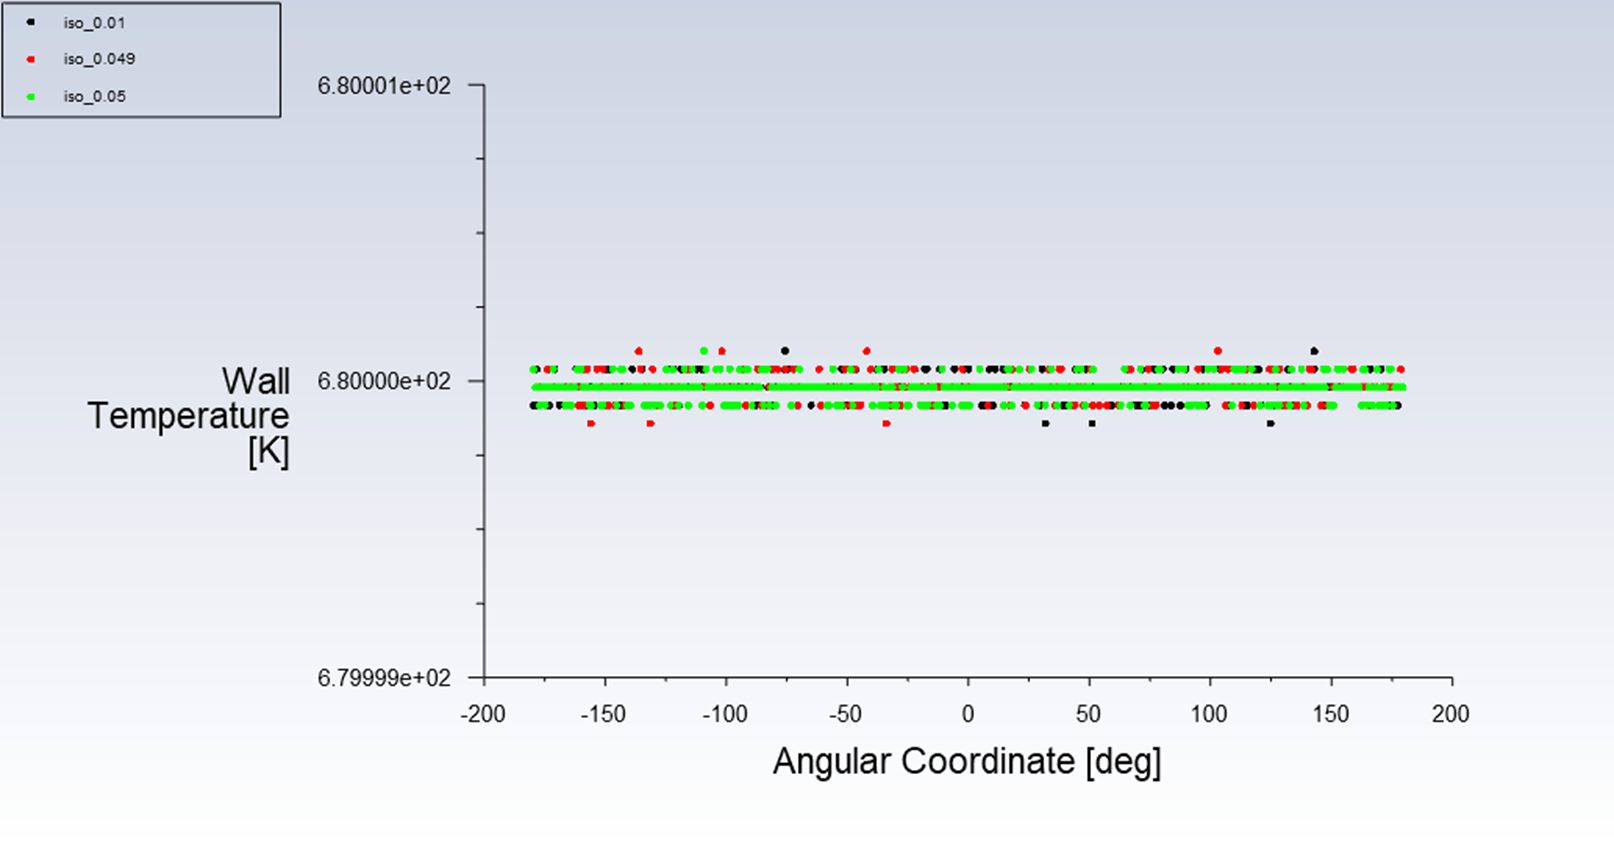
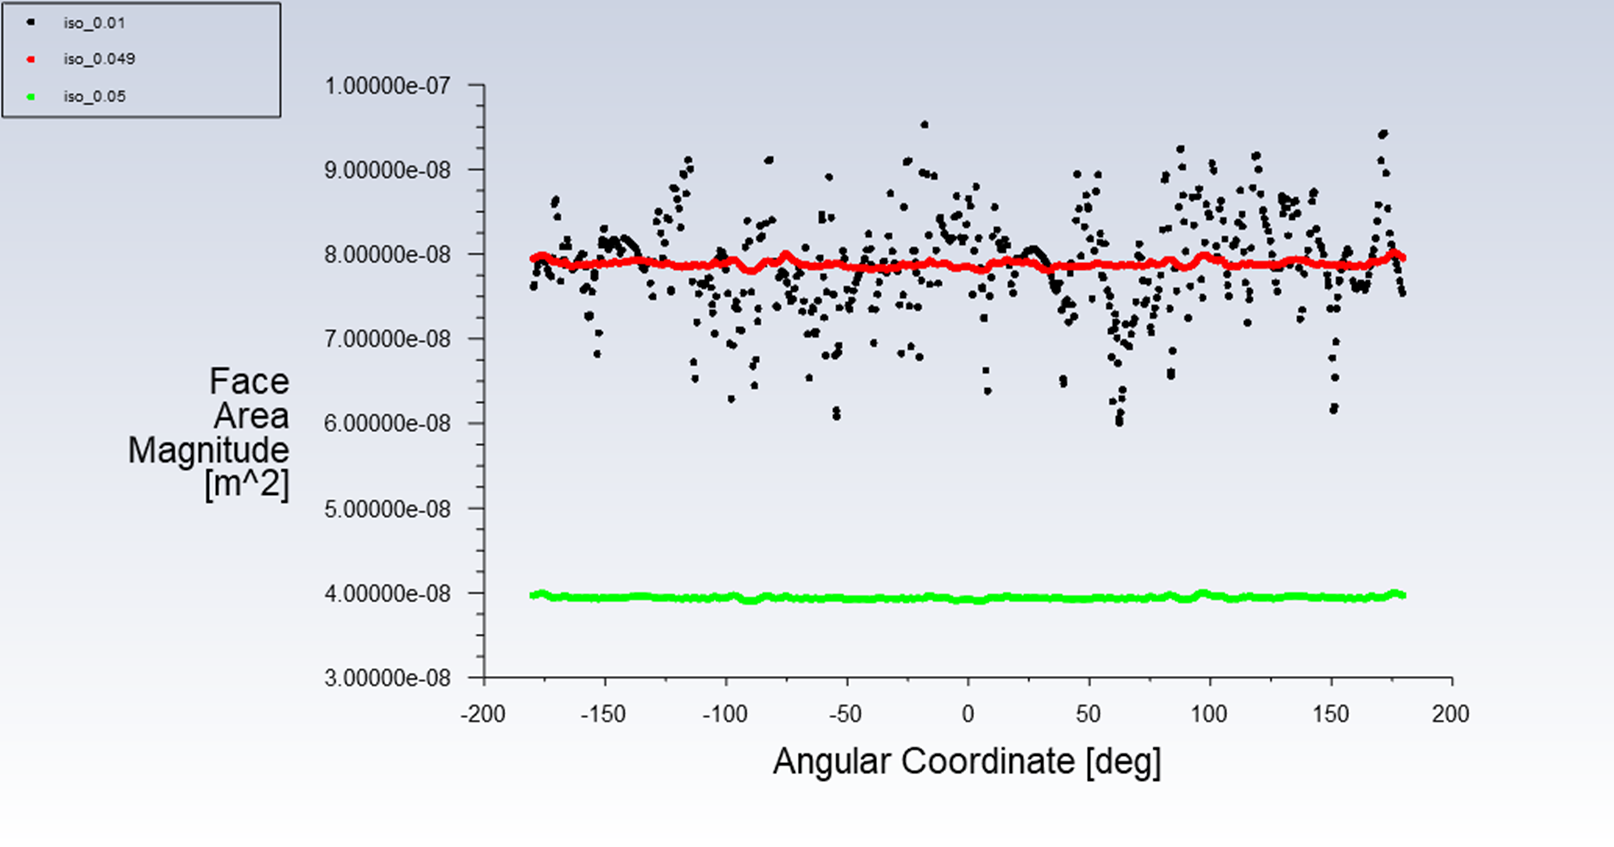
Hi, the boundary condition is a constant temperature (because I was trying to obtain the h coefficient distribution). Anyway, I plotted all the graphics. Many thanks!. The question is, what is the difference between iso lines at 0.01 versus 0.049, as the q” distribution is slightly different. Also, why are the results different for iso_0.05 (where the interface for the two fluid bodies is internal, I created it just to ensure I had 'clean data') compared to 0.049 (defined earlier), and why does 0.01 exhibit a lot of noise


