Ansys Learning Forum › Forums › Discuss Simulation › Photonics › why is Re data different? › Reply To: why is Re data different?
September 26, 2023 at 7:06 pm
Ansys Employee
Hi Sangmyeong,
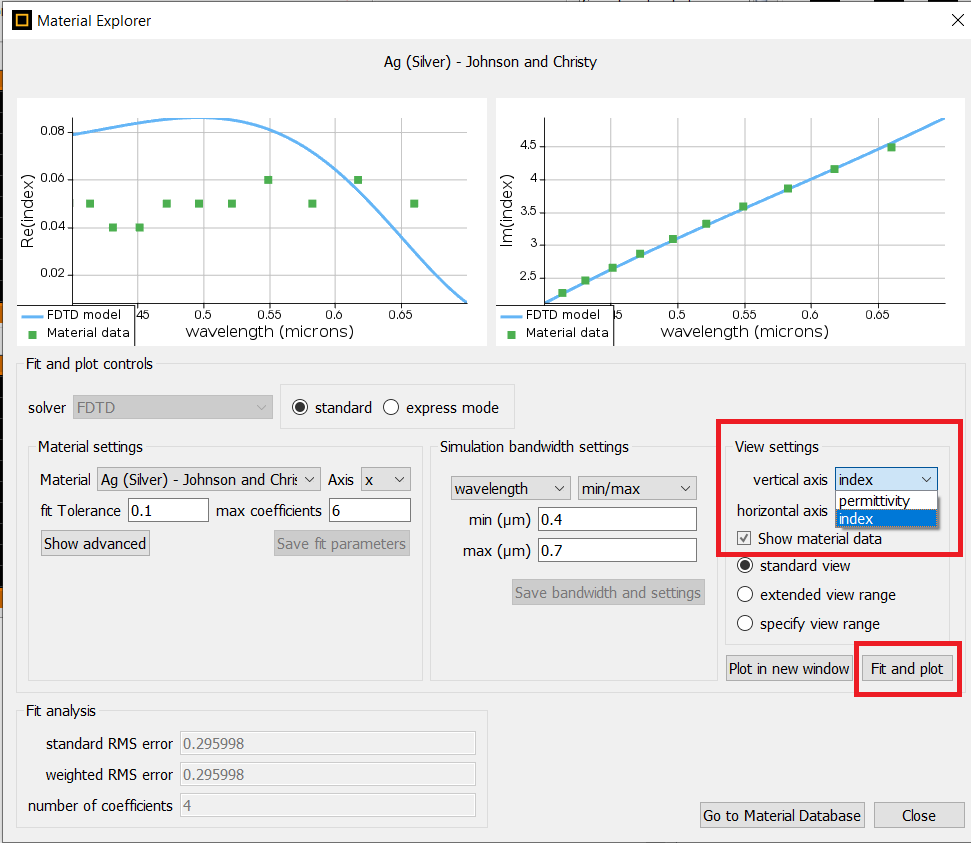
I believe that you have input the data correctly as can be seen from the second screenshot. In the plot, you are plotting the permittivity (instead of the index) which is the square of the index. I think that's is the only thing to consider here.
As shown above, in the view settings, from the "vertical axis" drop-down menu choose index and then click the "Fit and plot" option underneath it. You should be able to view the index vs wavelength data which you have input.
Regards,
Amrita


