Ansys Learning Forum › Forums › Discuss Simulation › Fluids › Radial averaging along complex pipe geometry › Reply To: Radial averaging along complex pipe geometry
August 16, 2023 at 12:34 pm
Subscriber
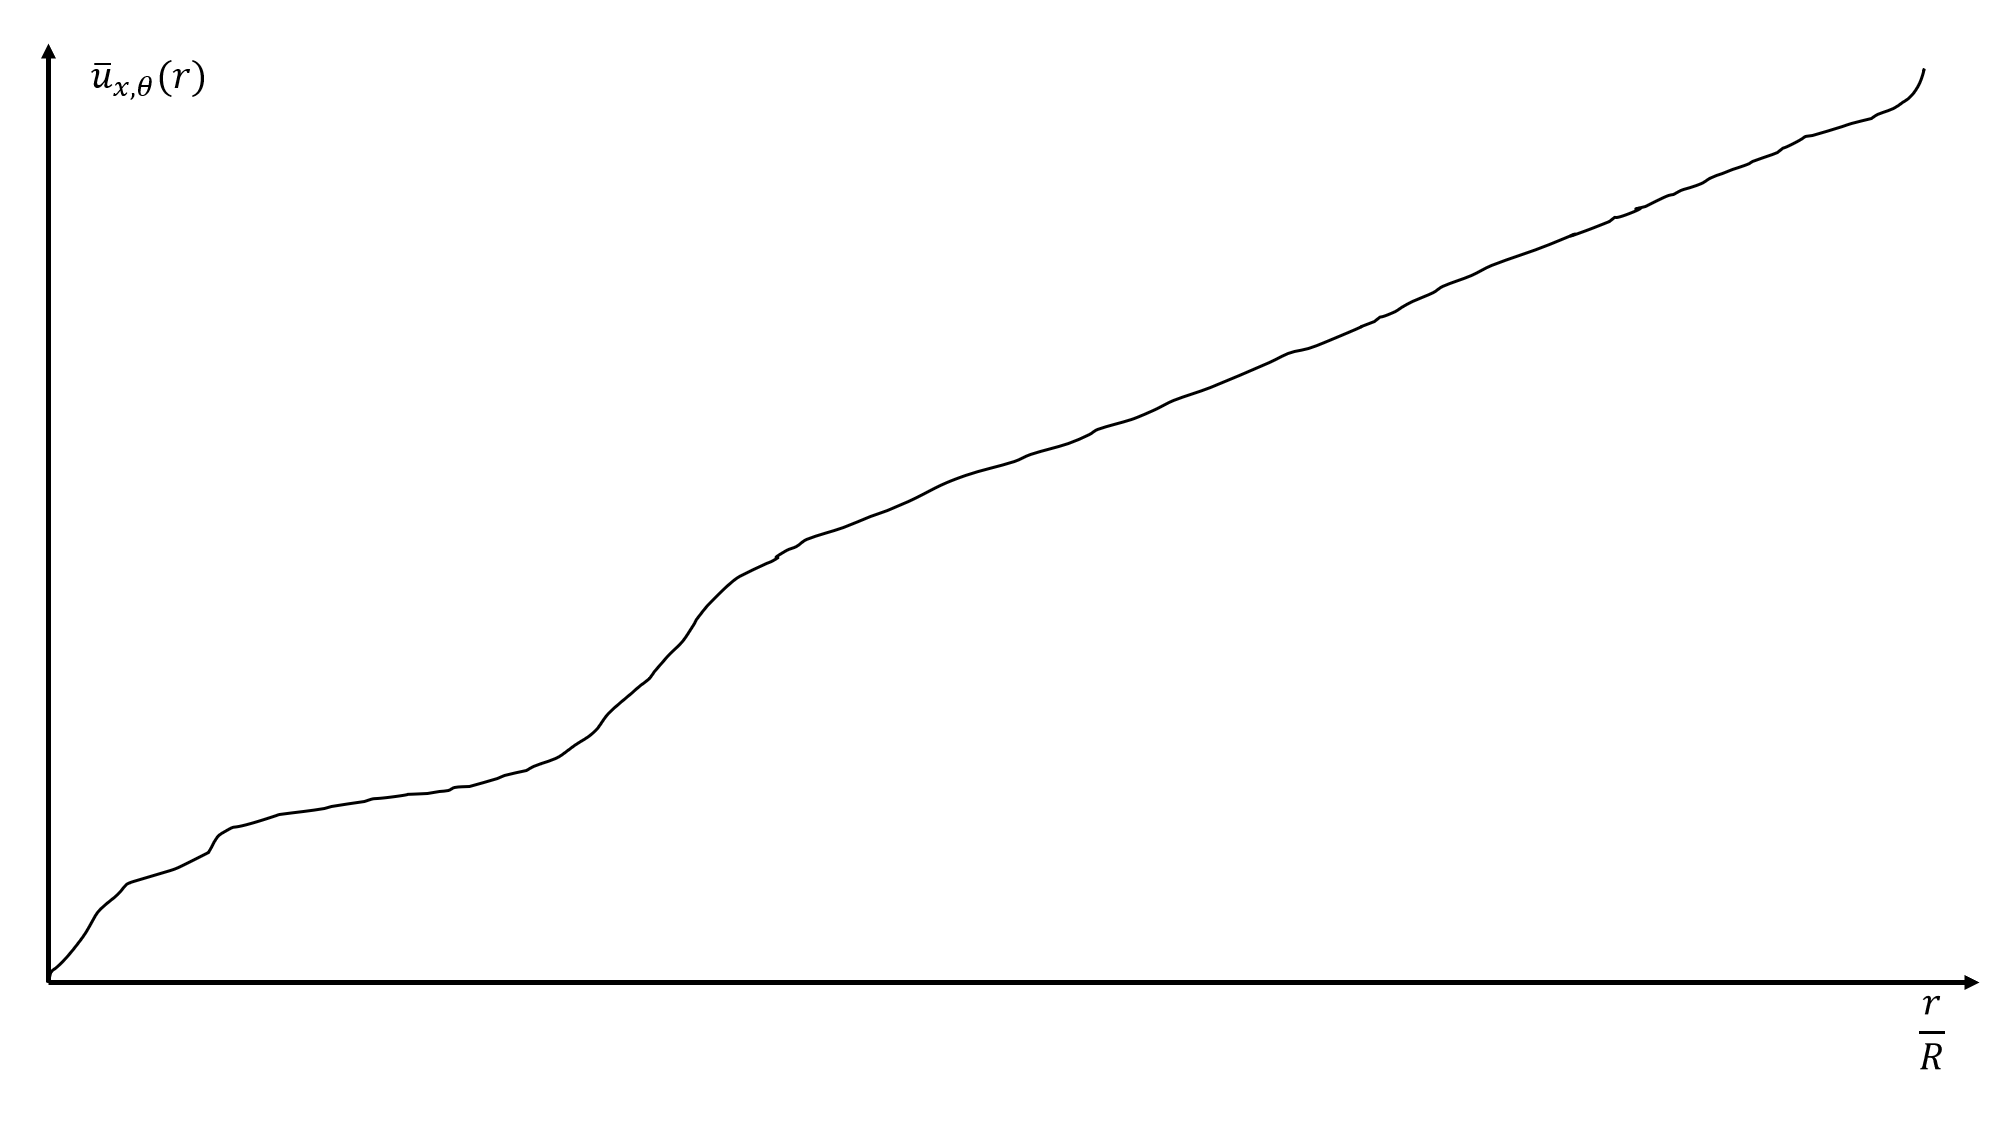
So the plot i want to generate will look something like this
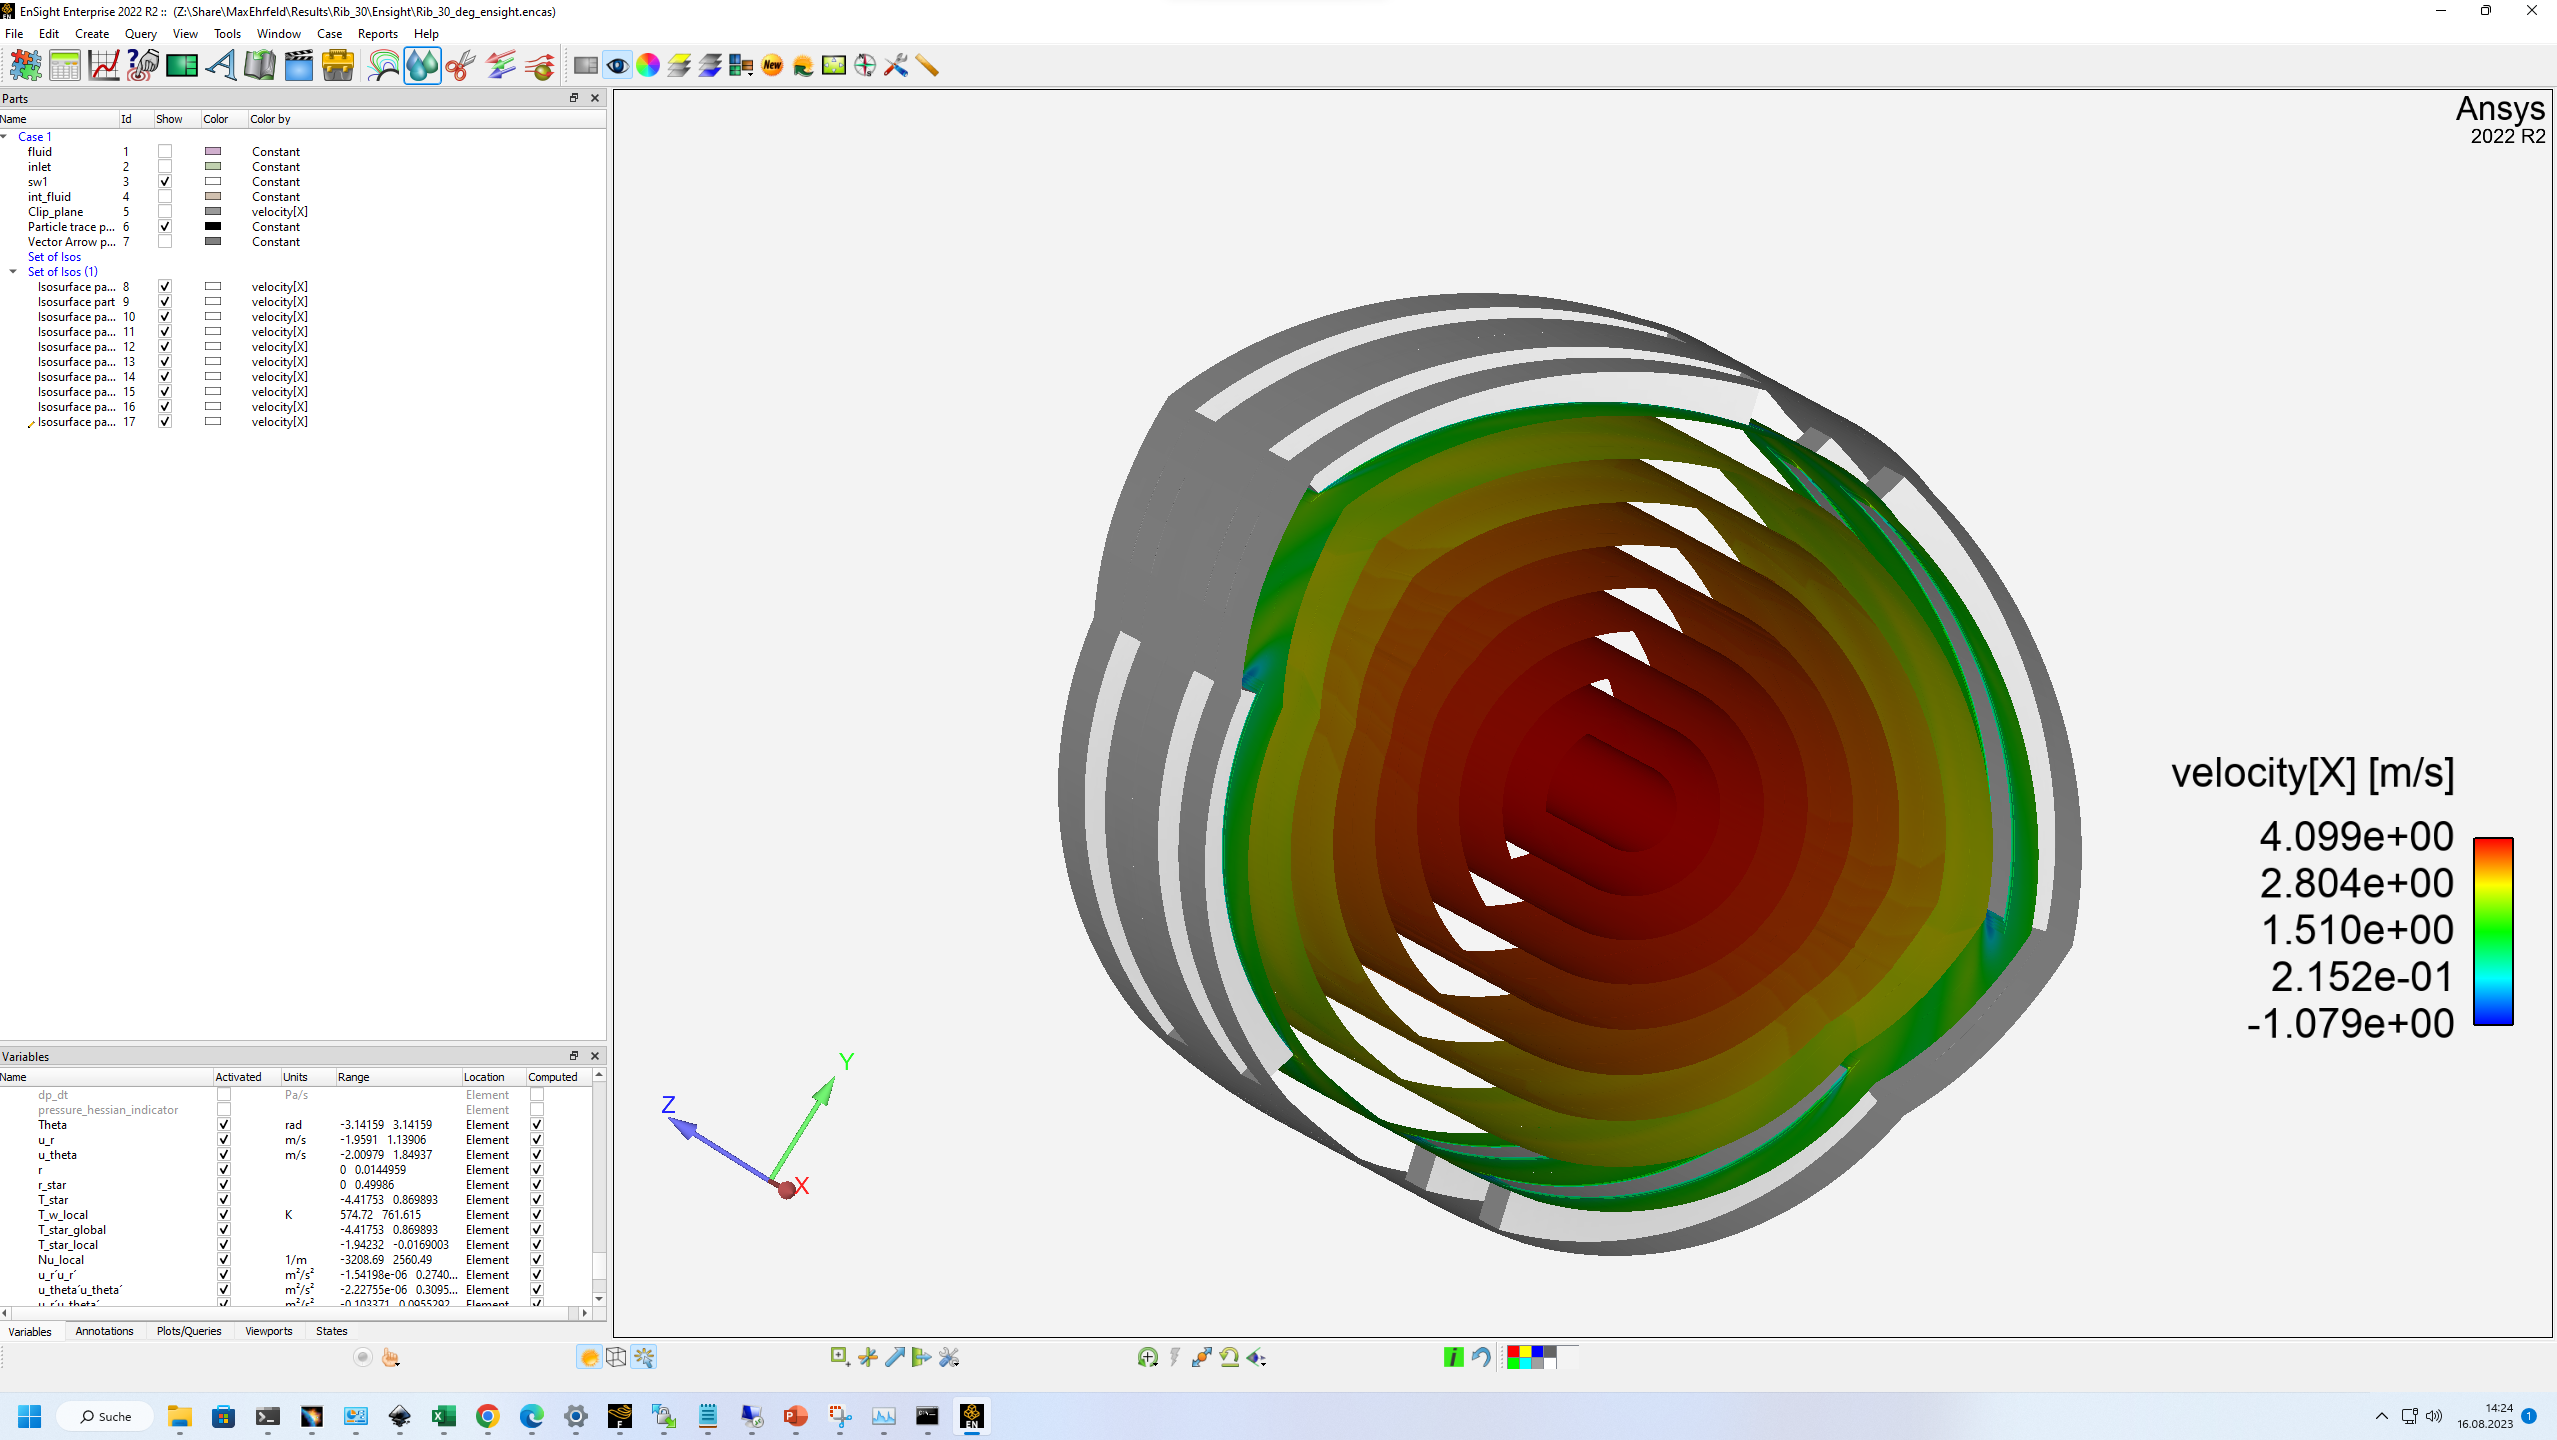
A Screenshot from ensight is below
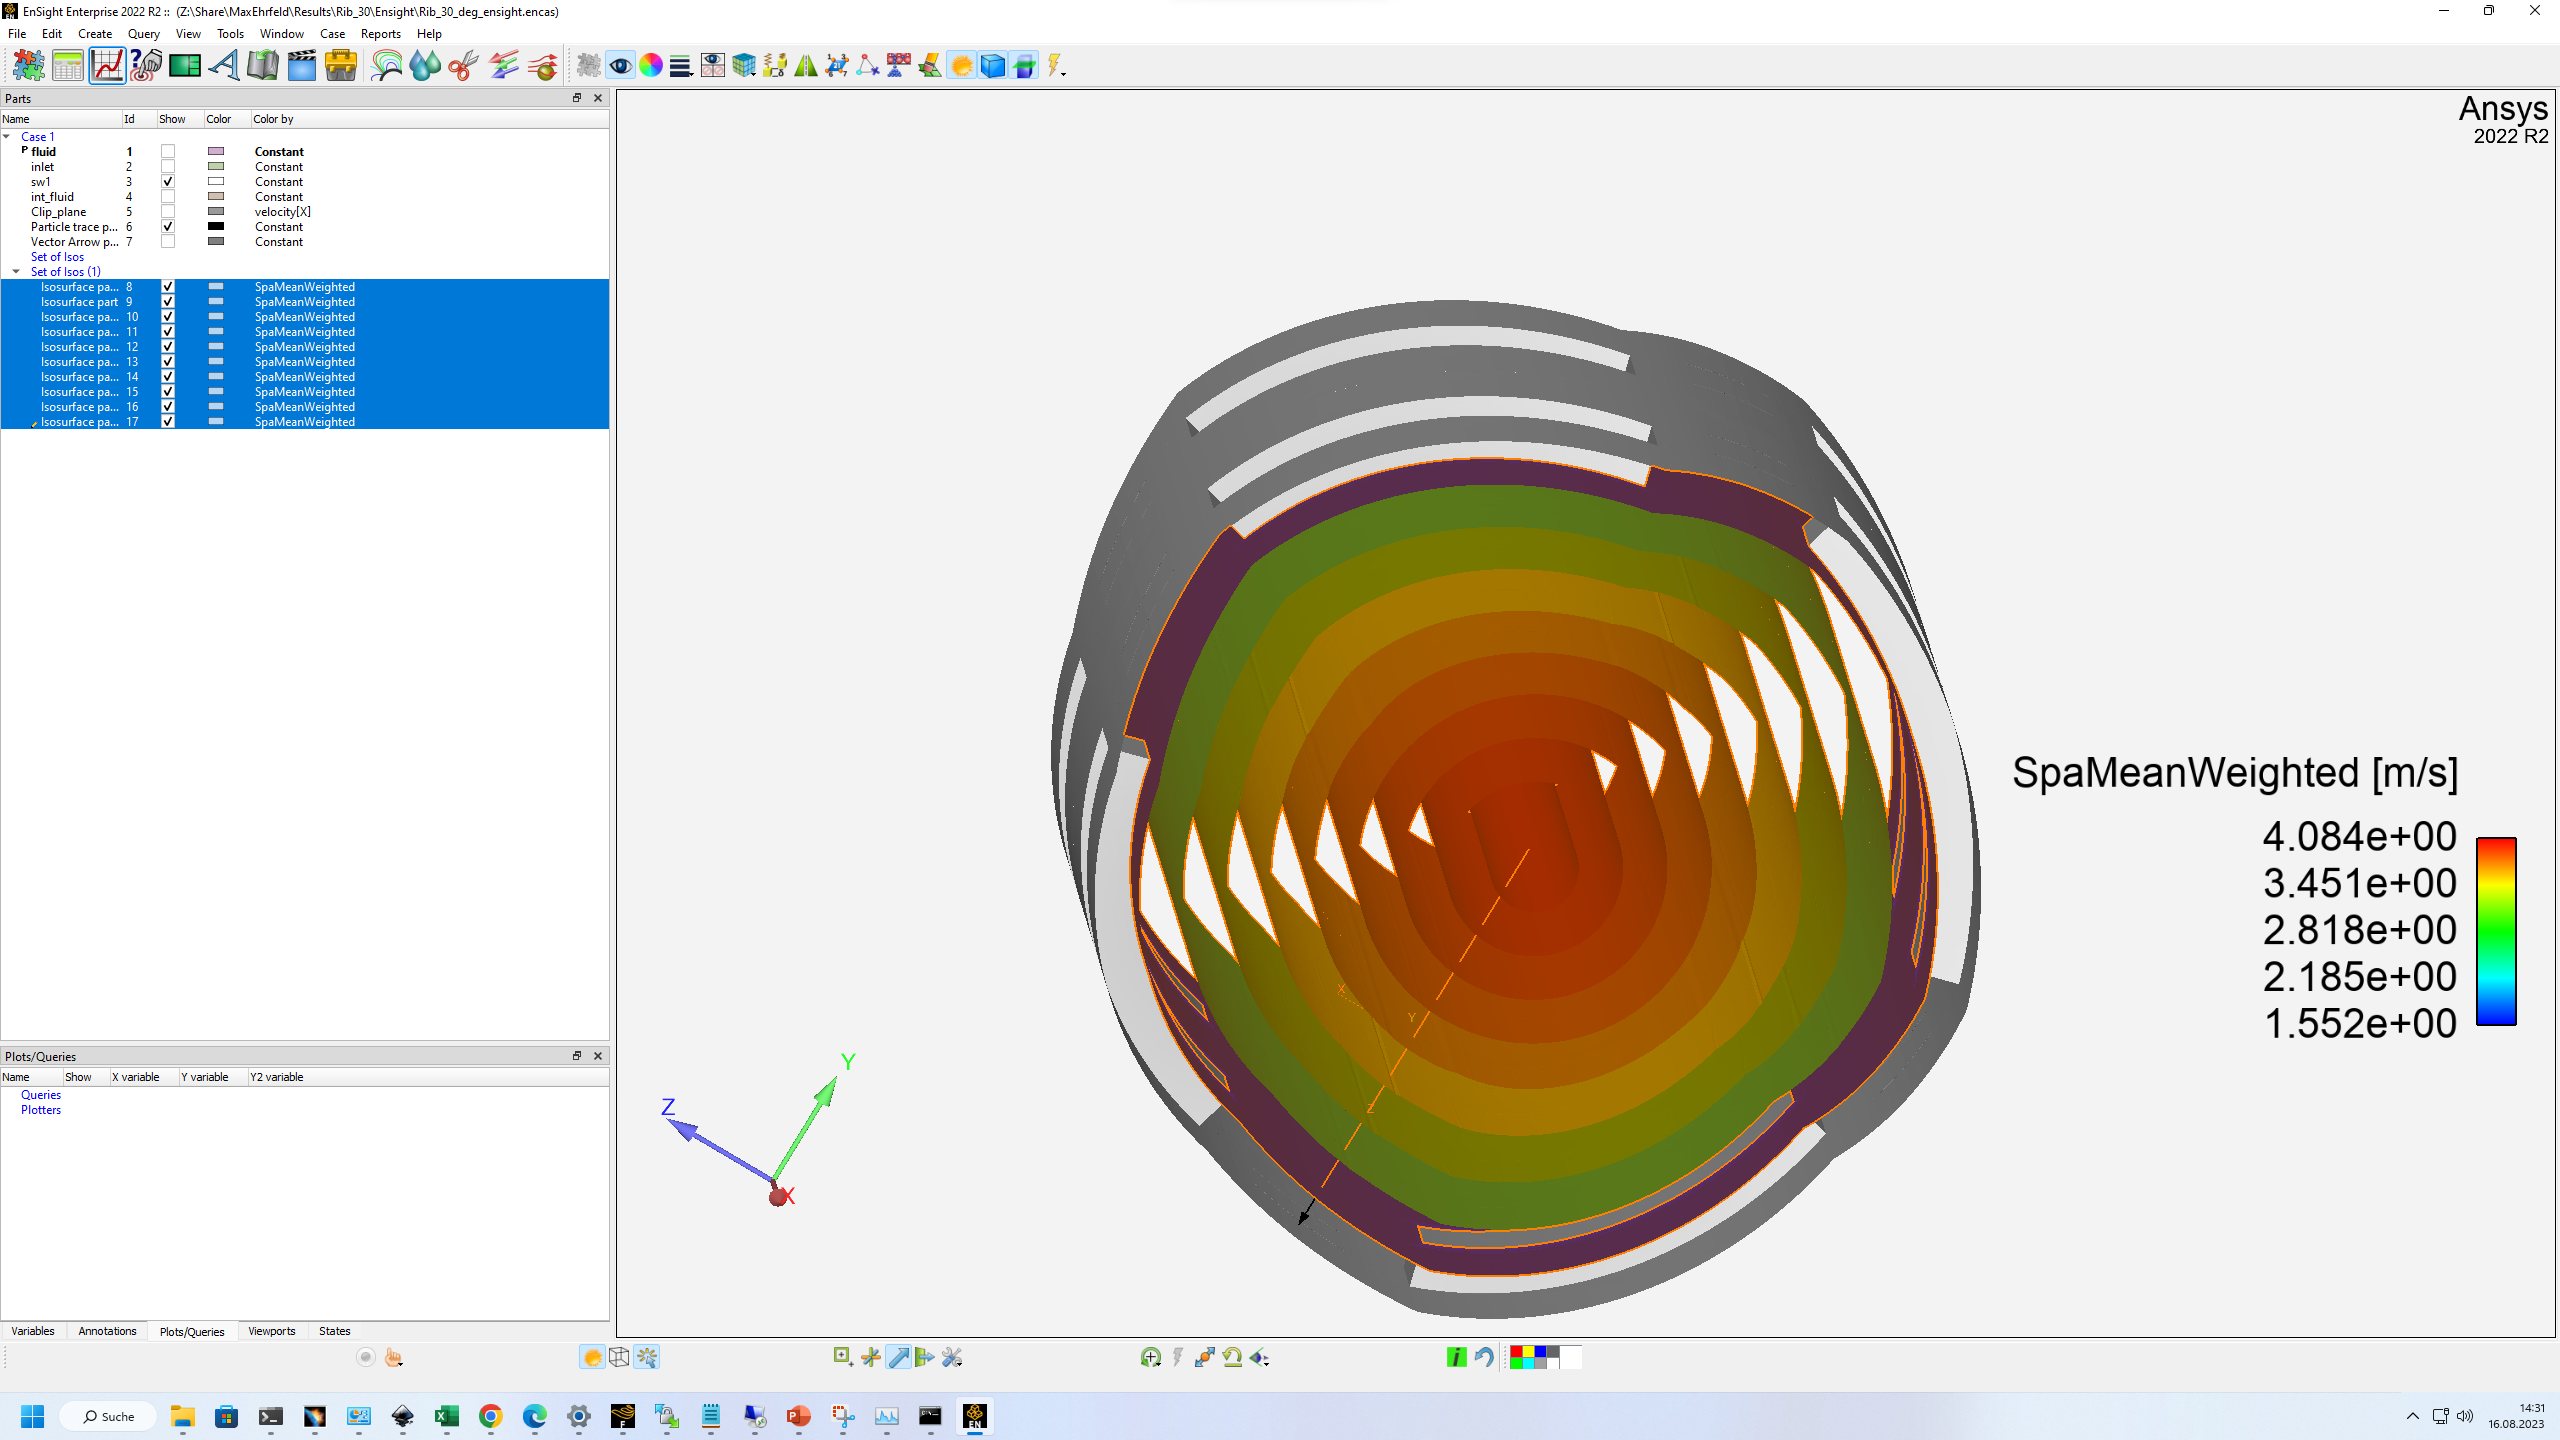
Do you mean create a function for the spatial average of the variable of interest, and evaluate that over surfaces of constant r, with a sufficient amount of isosurfaces to represent an average? That sounds like a good idea. How can i then create a plot from this data in Ensight? putting a Line tool perpedicular to the isosurfaces produces an error. Thank you very much for your help thus far


