Ansys Learning Forum › Forums › Discuss Simulation › General Mechanical › Base Excitation (Harmonic analysis) › Reply To: Base Excitation (Harmonic analysis)
Take the free courses in Modal analysis and Harmonic Response. Below is a summary of the steps you need to take.
In Workbench, drag a Modal analysis and drop it in the Project Schematic then drag a Harmonic Response and drop it on the Solution cell of the Modal analysis. This creates a Modal Superposition (MSUP) Harmonic Response analysis.
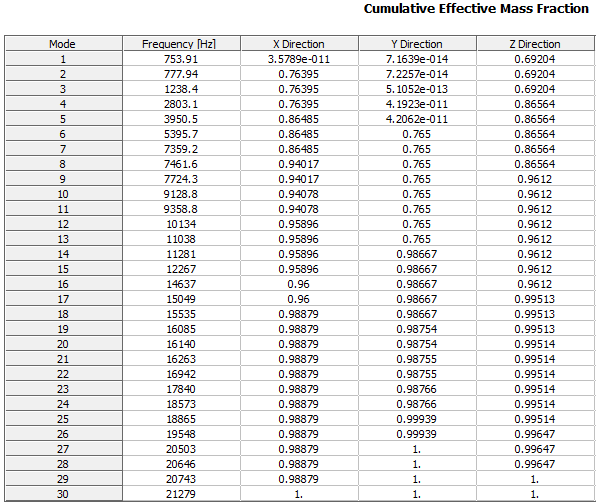
In the Modal analysis, add a Fixed Support to the faces/edges that are connected to the base (ground). Under Modal Analysis Settings, increase the Max Modes to Find to a large number such as 15 modes or higher. Solve the Modal analysis. Click on Solution Information and select Participation Factor Summary for the Solution Output. Scroll down and check the table of Cumulative Effective Mass Fraction. For the X, Y and Z directions, look to see the values have exceeded 0.9 in all three columns before the last mode or increase the number of modes if they have not.
With only 10 modes, you see that the Y direction suddenly goes to 1.0 at Mode 6 without having reached 0.9 first.
Increase the Max number of modes to find to 15 shows a more gradual increase.
With 30 modes, there are plenty of modes with values above 0.9 for the X, Y Z directions.
Another requirement is that the maximum modal frequency in the solution is at least 1.5 times higher than the highest frequency in the acceleration load to be used in the Harmonic Response. We can see that for this model, that requirement is easily met.
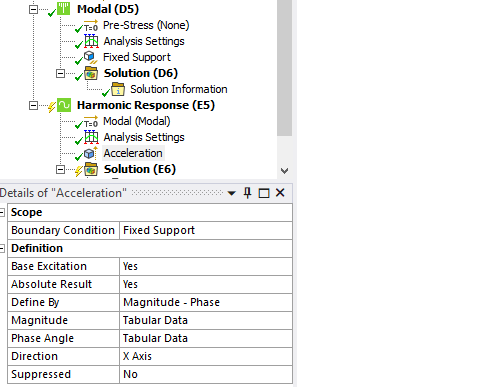
In the Harmonic Response branch, add an Acceleration Load. Set the Base Excitation to Yes and in the Tabular Data, enter two rows for 500 and 800 Hz with the correct values of acceleration (converted to m/s^2) and set the correct direction.
Look at the Analysis settings. It is very important to enter a Damping Ratio value to the model. I have used 5%, but you should determine the appropriate value for your structure. Use smaller values to be conservative.
Insert an Equivalent Stress plot and set it to Maximum over Frequency to find the worst stress over the frequency range requested.
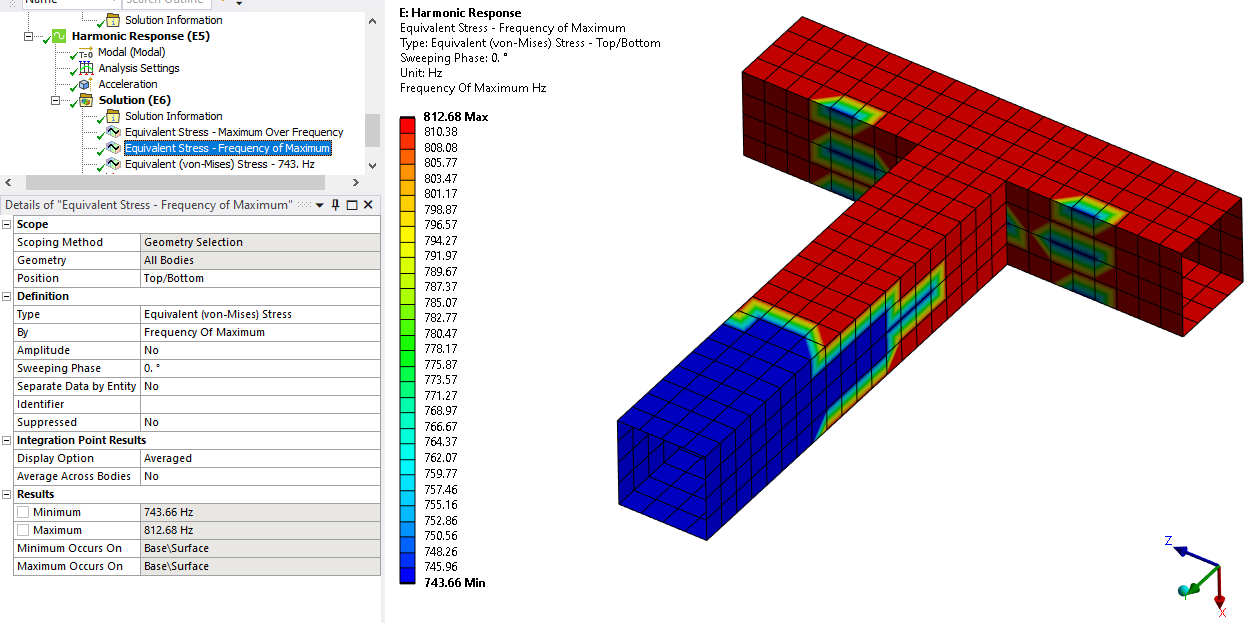
Insert another Equivalent Stress plot and set it to Frequency of Maximum to see what frequency has the worst stress.
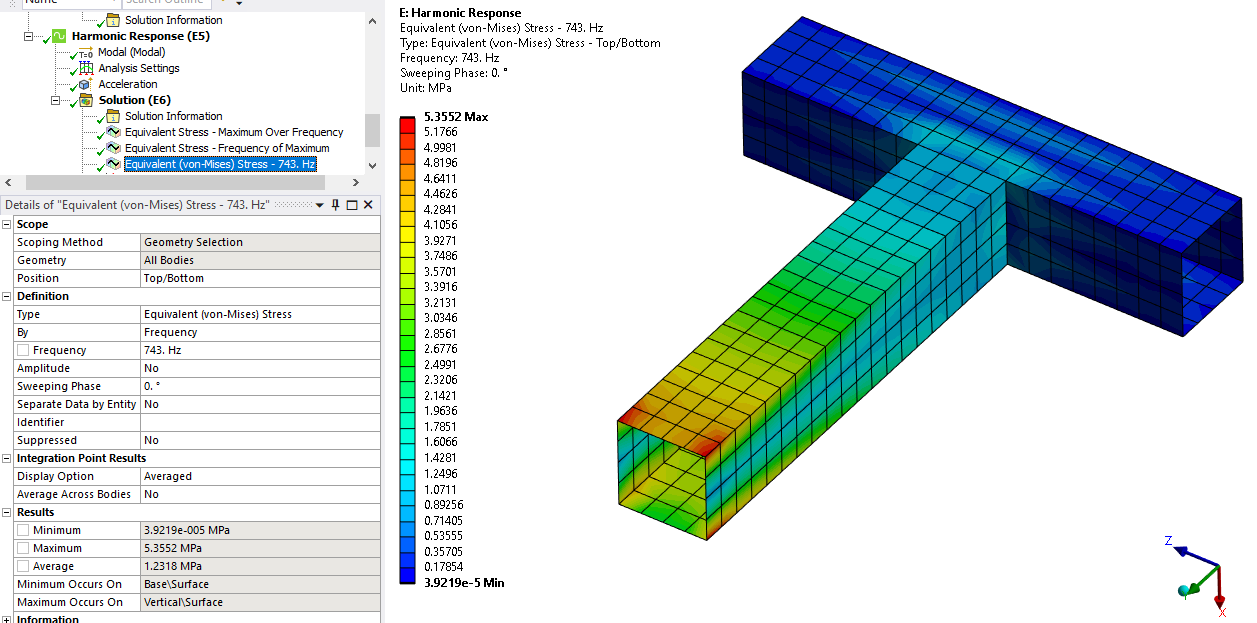
Finally insert an Equivalent Stress plot and set the frequency to see how the whole structure looks at that worst frequency.
I will post this reply without addressing the Fatigue analysis and the Life prediction. See if you can get your analysis to this point and reply back.


