Ansys Learning Forum › Forums › Discuss Simulation › General Mechanical › Frequency response limit › Reply To: Frequency response limit
October 13, 2021 at 11:19 am
Subscriber
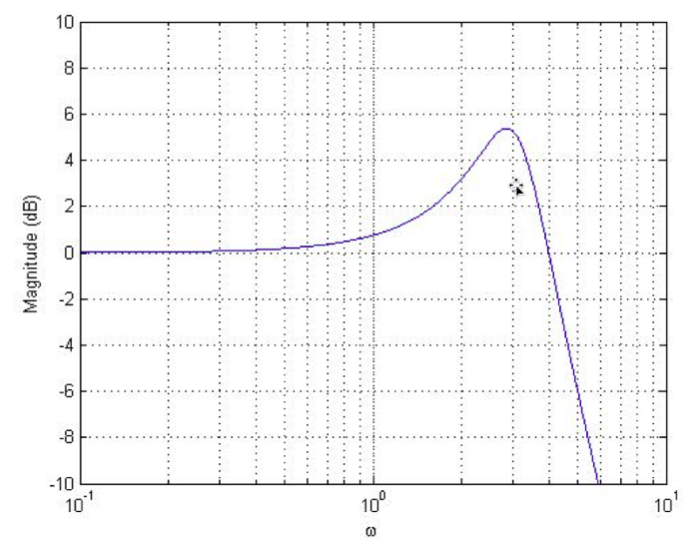
If you run a harmonic simulation you can get the frequency response as output. This gives you a Bode diagram showing the amplification in the frequency range specified. You will se that up to the resonance frequency the amplification is 1 (0 dB) or larger, but when you cross the resonance frequency it rapidly declines. There is no hard limit to which frequencies the structure will respond to, you have to decide at what frequency the amplification is small enough to be negligible.


