
-
-
October 13, 2020 at 9:31 am
fetseck
SubscriberIn Workbench (ANSYS 2020 R2) I currently have a simple parametric design study as follows:
October 13, 2020 at 3:17 pmRahul Kumbhar
Ansys EmployeenYou can parameterize Display time in result. n Or you can insert multiple result and plot them at different time. Parameterize the outputs of all the results.n
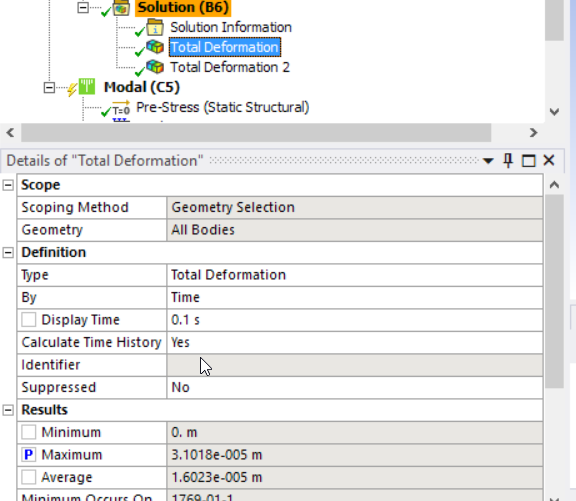 n
October 15, 2020 at 12:49 pmSubscriberFantastic!nI inserted multiple results and plotted them at different times. This also saved time during the simulation.nThank you!nViewing 2 reply threads
n
October 15, 2020 at 12:49 pmSubscriberFantastic!nI inserted multiple results and plotted them at different times. This also saved time during the simulation.nThank you!nViewing 2 reply threads- The topic ‘How to output a graph/ table instead of single float in parameter design study?’ is closed to new replies.
Innovation Space Trending discussions
 Top Contributors
-
peteroznewman
 5049
5049 -
scabo
 1759
1759 -
Dennis Chen
 1387
1387 -
javat33489
 1248
1248 -
Shyam Prasad V Atri
1021
Top Rated Tags
© 2026 Copyright ANSYS, Inc. All rights reserved.
Ansys does not support the usage of unauthorized Ansys software. Please visit www.ansys.com to obtain an official distribution.
-


The Ansys Learning Forum is a public forum. You are prohibited from providing (i) information that is confidential to You, your employer, or any third party, (ii) Personal Data or individually identifiable health information, (iii) any information that is U.S. Government Classified, Controlled Unclassified Information, International Traffic in Arms Regulators (ITAR) or Export Administration Regulators (EAR) controlled or otherwise have been determined by the United States Government or by a foreign government to require protection against unauthorized disclosure for reasons of national security, or (iv) topics or information restricted by the People's Republic of China data protection and privacy laws.
