Hey,
I am trying to reproduce pressure coefficients from a CFD study on inclined ground-mounted solar PV panels using standard/ RNG k–ε model.
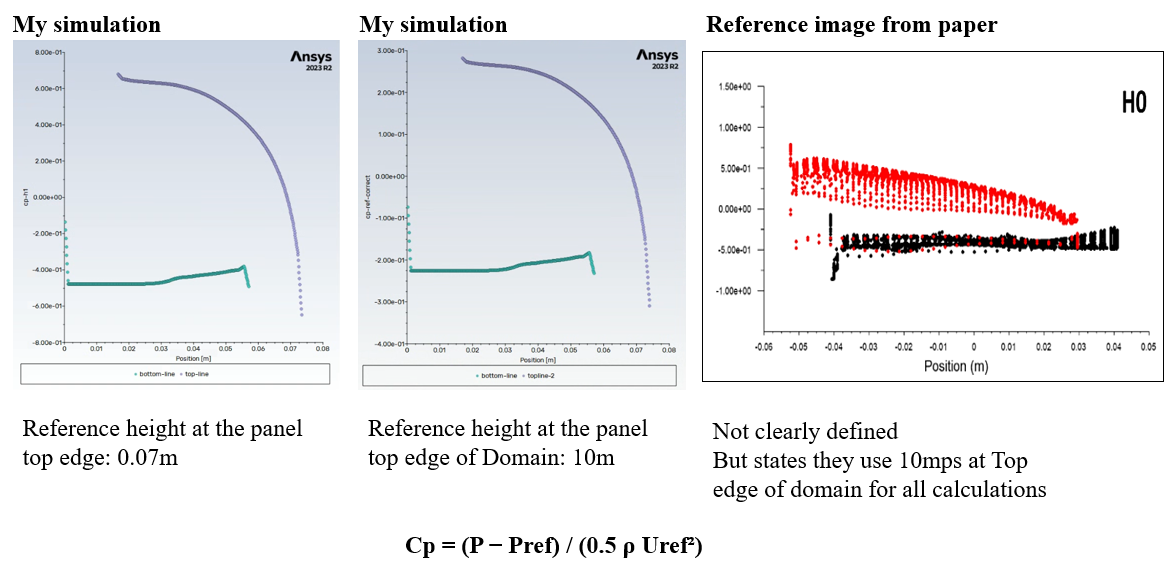
My panel-face y+ is within the recommended wall-function range, around 30 to 300, but the surface pressure/Cp values on my panel are still lower than the reference paper.
The paper reports relatively high net pressure coefficients in the range of 0.75 max for the top panel and -0.5 to -0.75 on the back panel.
I have checked the mesh y+, but I am still not matching their Cp levels.
What could cause lower Cp values in my simulation, even when the turbulence model and y+ range seem similar?
This is the paper's name, I'm specifically concerned about the Figure 7a. for H0.
AERODYNAMIC AND STRUCTURAL ANALYSIS OF ASOLAR PANEL - Yemenici, O. & Oruc, E. nt j simul model 24 (2025) 2, 191-202
My analysis is that the model is probably predicting low static pressure on the surface and hence a lower cp value