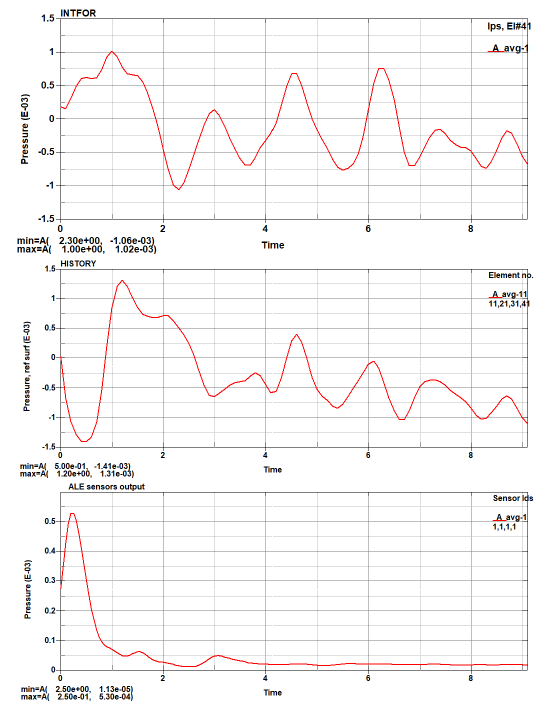
In post-processing I need to plot the pressure on a few shell elements, I used the SALE method to simulate a shell impact on the water.
Using Post - History - Element/Integration points to plot the results for the same points I get different plots.
Also defining a FSI Sensor (same elements) the plot is different.
I don't know why and which is the correct (the sensor results are more attendible than the other ones).


