Ansys Assistant will be unavailable on the Learning Forum starting January 30. An upgraded version is coming soon. We apologize for any inconvenience and appreciate your patience. Stay tuned for updates.
General Mechanical

General Mechanical

Topics related to Mechanical Enterprise, Motion, Additive Print and more.

stresses of shell elements

TAGGED: 

    • 2020221038
      Subscriber

      How does ANSYS perform envelope analysis for stresses on inner and outer surfaces of shell elements?

    • peteroznewman
      Subscriber

      When you plot stress on a shell element, the default setting for Position is Top/Bottom, which you call inner and outer. This displays the Top stress on the top side of the element and Bottom stress on the bottom side of the element. In the first image, the view is looking in the +Z direction.

      In the second image, the view is in the -Z direction.

      It is possible to plot only the Top stress on both sides of the shell so you can see that from either side. The above is for a Static Structural analysis.

      In a Transient analysis, there are other settings to find the Maximum Value Over Time.

      • 2020221038
        Subscriber

        Thank you for your response. When dealing with a large number of shell elements and operating conditions, manual inspection is no longer feasible. I would like to know if there is a batch processing method available?

    • peteroznewman
      Subscriber

      You can have a large number of shell elements on a Static Structural model with multiple load steps designated by Time steps and the Stress plot details window shows the envelope of the maximum value over time as shown above for the Transient, but this works for Static Structural for a multi-step solution.

      There is a capability to have many Static Structural analyses and insert a Solution Combination folder to allow you to define linear combinations of all the analyses.  One example is a project that has 4 analyses such as a 1G load in the X direction, a 1G load in the Y direction and a 1G load in the Z direction and a 1 degree C temperature increase from the envinromental reference temperature. Create 4 combinations, one for each analysis.

      Create a Stress result that is by Maximum Over Combinations, then in the details window, you see the maximum value.

      A more interesting example is if you wanted to subject a structure to a 10G load in any direction, you could create a large number of combinations in a table using formulas in Excel that compute the direction cosines for the X, Y and Z coefficients of the 1G solution in those three directions to create dozens of points around a sphere and have the solution combination find the worst case stress for 10G in any direction.

      • 2020221038
        Subscriber

        Hello, I require the maximum stresses at the top and bottom of each shell element for structural reinforcement design.

    • peteroznewman
      Subscriber

      Did my previous response answer your original envelope analysis question? Your last reply seems like a new question unrelated to envelope analysis.

      The stress plot shows the maximum stress at the top and bottom of each shell element using a color code. You have the option to change the display from Averaged which creates nodal average stress to Unaveraged which will plot only the stress in the element without regard to the other elements attached to shared nodes.

      Or do you mean you want text output of the stress in each element exported along with the element ID?

      Please reply with a detailed description of the structural reinforcement design process so I can understand what you are trying to do.

    • 2020221038
      Subscriber

      I want text output of the stress in each element exported along with the element ID.The spacing of reinforcing bars must be designed based on the maximum tensile stress in each element. Therefore, I need to extract the maximum stress values from the top and bottom surfaces of each element.

    • peteroznewman
      Subscriber

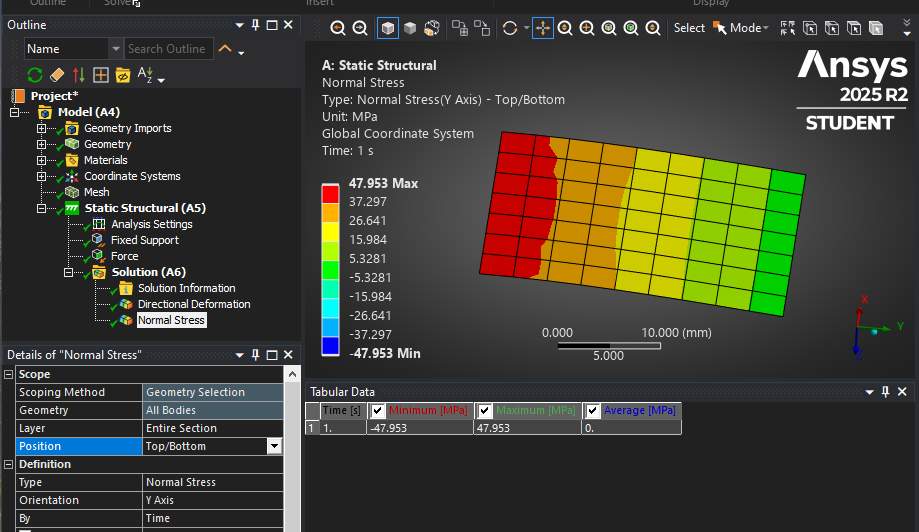
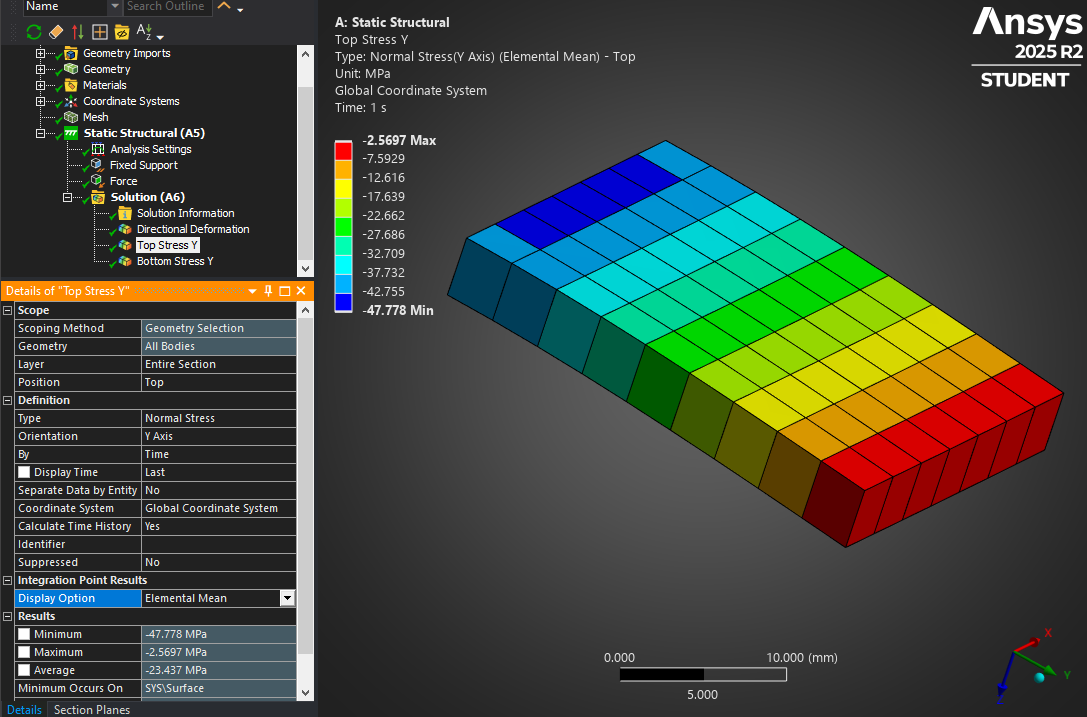
      I recommend you set the Display Option to Elemental Mean on the Normal Stress Result, Select the Orientation of Y Axis and the Positon of Top.

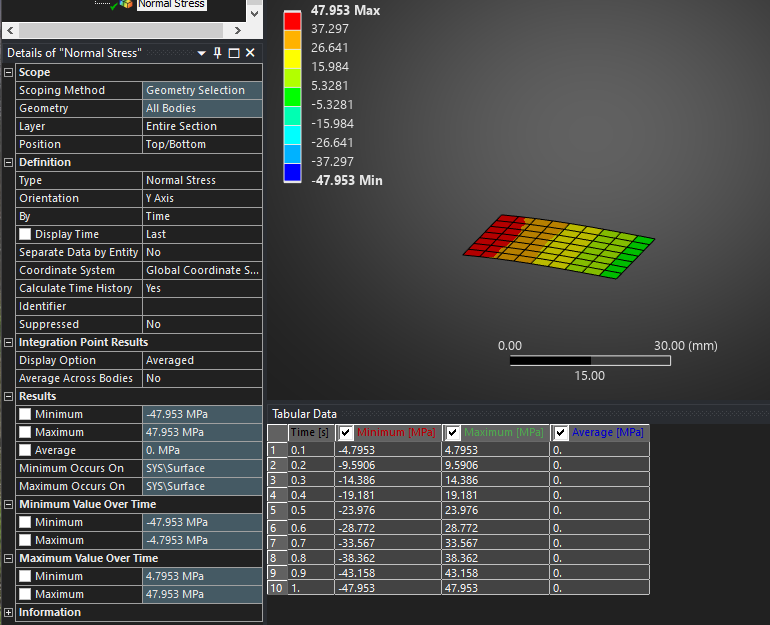
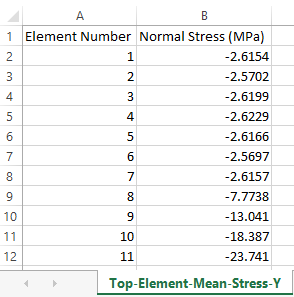
      When you right click on that result in the outline, you can Export Text File.  If you have Excel installed, that will launch and show the contents of the text file.

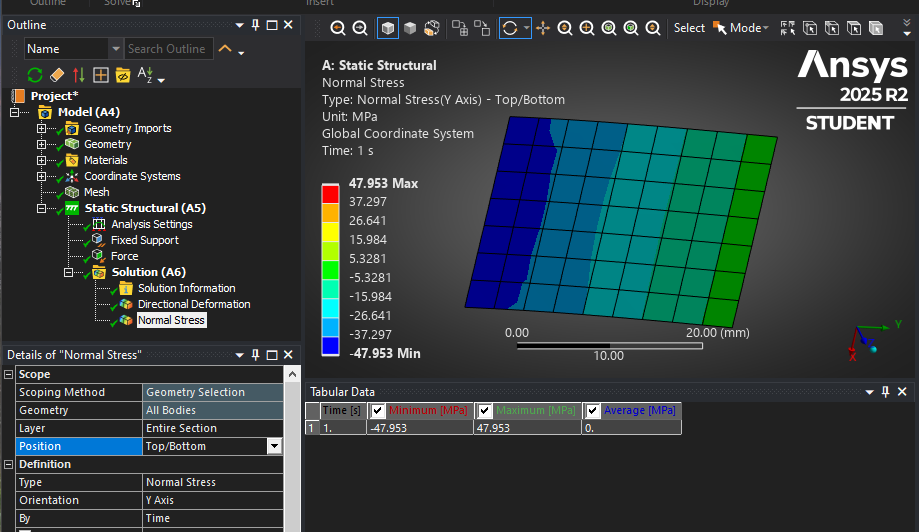
      Repeat for the X orientation, repeat for the Bottom position then you will have four values for each element: Top/Bottom in X/Y.  For shell elements, the stress along the shell normal direction is zero. In this simple example, the plate was in the X-Y plane so I used Global coordinates. If your geometry had a plate at a 45 degree angle to the global coordinates, then you would want to create a coordinate system that lies in the plane of that plate before you export the stress in that coordinate system.

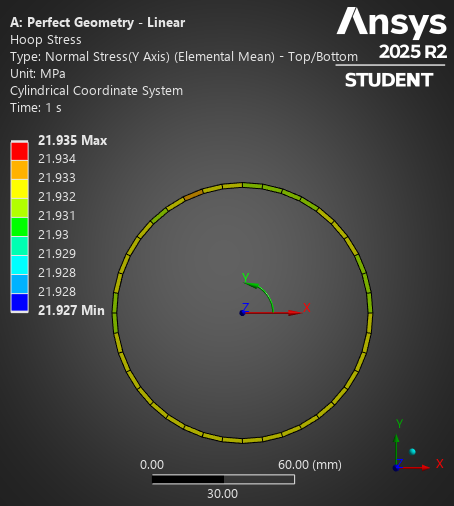
      If your geometry was a cylinder, then you would need to create a cylindrical coordinate system where the X axis is the radial direction, and this is the direction that has zero stress so you would extract stresses for the Y Axis which is the tangential or Hoop Stress direction and the Z Axis which is the axial direction.

    • 2020221038
      Subscriber

      Thank you very much for your response. You mentioned performing this operation in Workbench. How would one perform this part in APDL?

Viewing 6 reply threads
  • You must be logged in to reply to this topic.
[bingo_chatbox]