-
-
May 17, 2020 at 12:02 pm
saurabhiitk
SubscriberDear friends
1) I have been trying to do non linear analysis of circular honeycomb lattice structure made of ABS (Acrylonitrile Butadiene Styrene) on ANSYS.Â
2) I am getting huge difference between experimental (compression test) and simulated results. I am trying to compare the force-displacement diagrams obtained from experiment and simulation.
3) i have attached the force displacement diagrams below. blue curve is the experimental and red curve is the simulated result.Â
4) As we can see the difference is huge. please help me out to reduce this huge difference by giving me some suggestions.Â
please help me out.Â
-
May 17, 2020 at 2:07 pm
peteroznewman
SubscriberYou should include a legend on plots with two curves so we know which one is which.
-
May 17, 2020 at 3:22 pm
saurabhiitk
SubscriberHello sir
1) Nice to reconnect with you after a long time.
2) I had already mentioned that blue curve is the experimental results and red the simulation result.
3) Well I am using the experimental data obtained from tensile test of ABS material.
4) How much should the magnitude be increased to get the required result?
5) I had already used the same tensile test data for hexagonal lattice structure about which we discussed in this discussion SIMULATION OF COMPRESSION TEST IN ANSYS
6) I got satisfactory results for hexagonal lattice structure but i am not able to get the satisfactory value for the circular lattice structure.
7) Do you have some another set of data for tensile test of ABS? ( In case you think my data is incorrect).
Is there any error in my problem formulation?
please reply ASAP.Â
-
May 17, 2020 at 8:25 pm
peteroznewman
SubscriberYou have a professor who is there to teach you. What does the professor say?
-
May 18, 2020 at 5:24 am
saurabhiitk
SubscriberSir
thanks for your reply.
1) I am doing this for my thesis. I do not have any professor to guide me. Due to corona crisis we all have been sent home. I am not even in my college campus to ask help from any professor.Â
2) My primary aim is to compare the force displacement curve obtained from experiment and simulation.
3) I have run number of simulations in last one month by applying different contact formulations. I even tried to increase the yield strength by around 15 Mpa just to check whether it makes any major difference but it did not.Â
4) I have attached the design of lattice structure below for your reference.Â
5) Can you suggest me some corrective measures to be taken so as to get the accurate results? should i attach the ANSYS workbench file so that you can check my problem formulation?Â
Please reply ASAP.Â
-
November 12, 2020 at 7:53 pm
ssbb
SubscriberHello Saura..,nI hope you found the solution of your problem because I have the same problem, can you help me please ?n1- did you use a static structure ?n2- In your tensile test, did you apply a force or a displacement ?n3- I obtained these results, there is no maximum in strength like the experimental, I don't know whyn
n
-
- The topic ‘
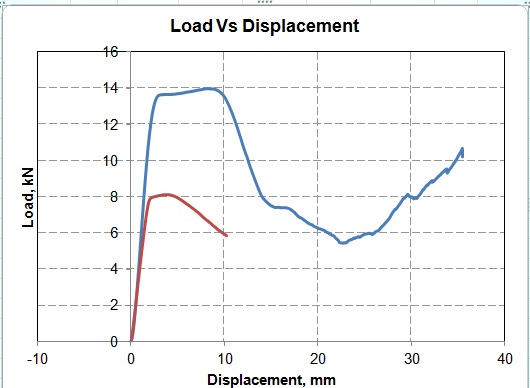
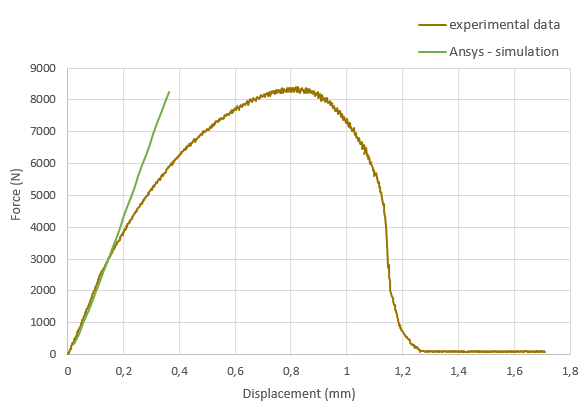
DIFFERENCE BETWEEN EXPERIMENTAL AND SIMULATION RESULTS’ is closed to new replies.
-
6670
-
1906
-
1469
-
1313
-
1022
© 2026 Copyright ANSYS, Inc. All rights reserved.

