-
-
August 21, 2025 at 2:43 am
2973391932
Subscriber1. When the reference field of view is set to a field angle size of 0, the size of the Grid distortion is similar to that in the Field curv/Dist graph; however, when the maximum field angle is selected, the maximum distortion displayed by the Grid distortion is significantly different from the former. What is the reason for this?
2. Is the maximum distortion given by the optical indicators the size of the reference Field curv/Dist graph or the size in the Grid distortion, or do all of these need to be referred to?
3. If the value of the Grid distortion at the maximum field angle needs to be reduced, what method should be used to solve it? I have tried using DIMX, DISG, etc. operators to reduce it, but the effect seems not very obvious.


-
August 21, 2025 at 10:09 pm
michael.humphreys
Ansys EmployeeHi,
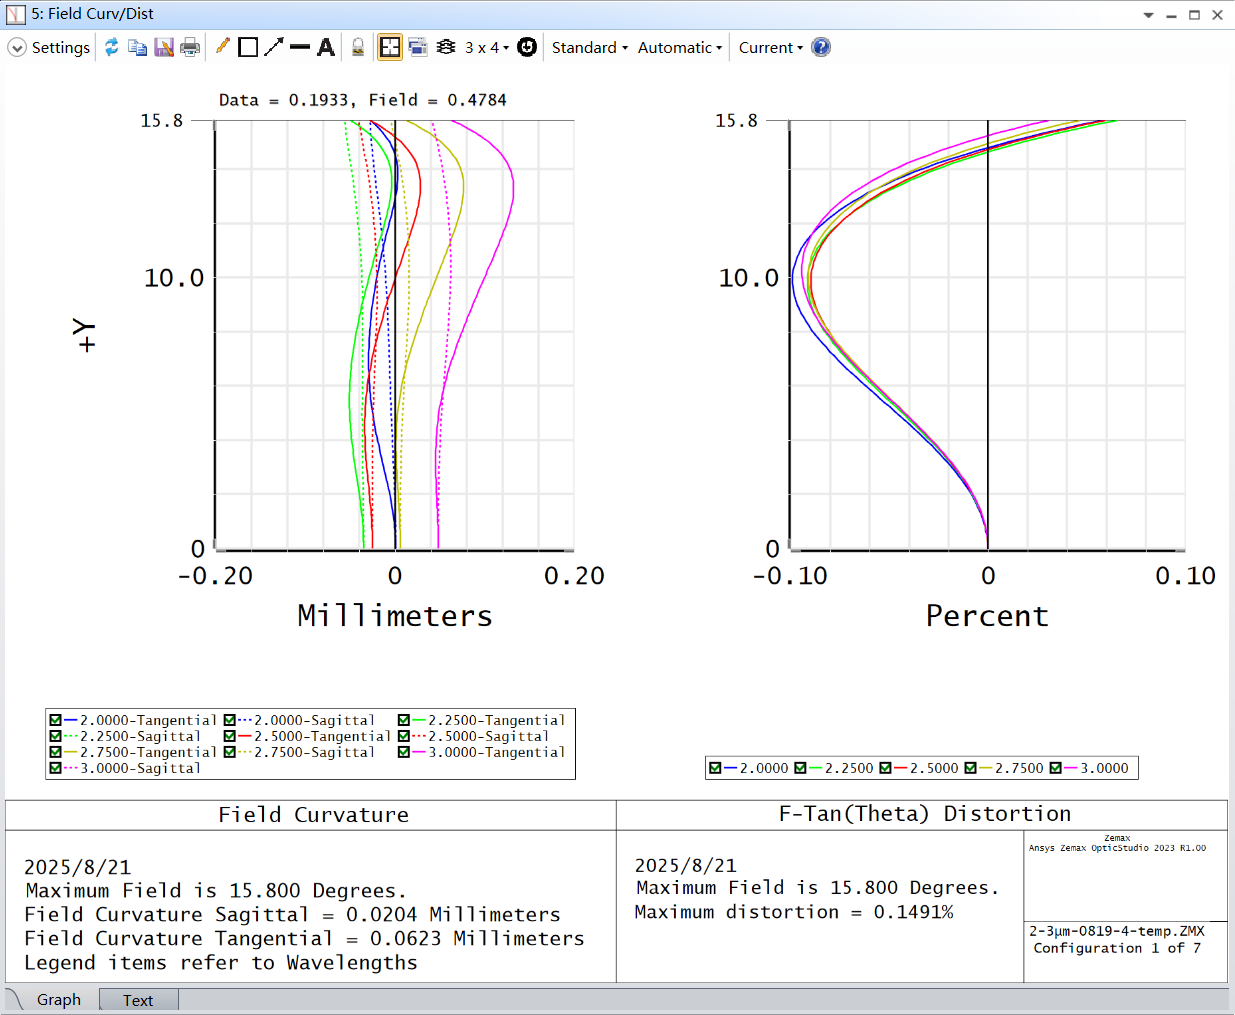
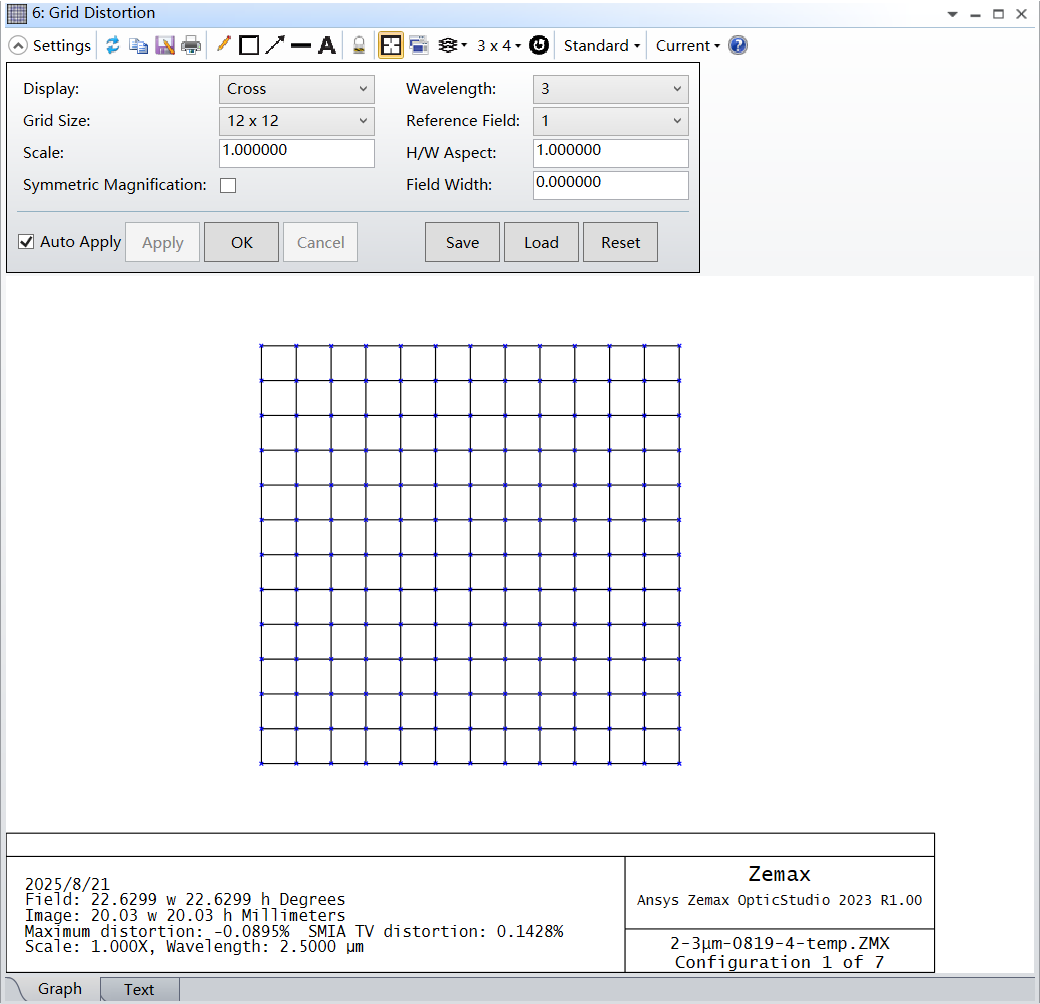
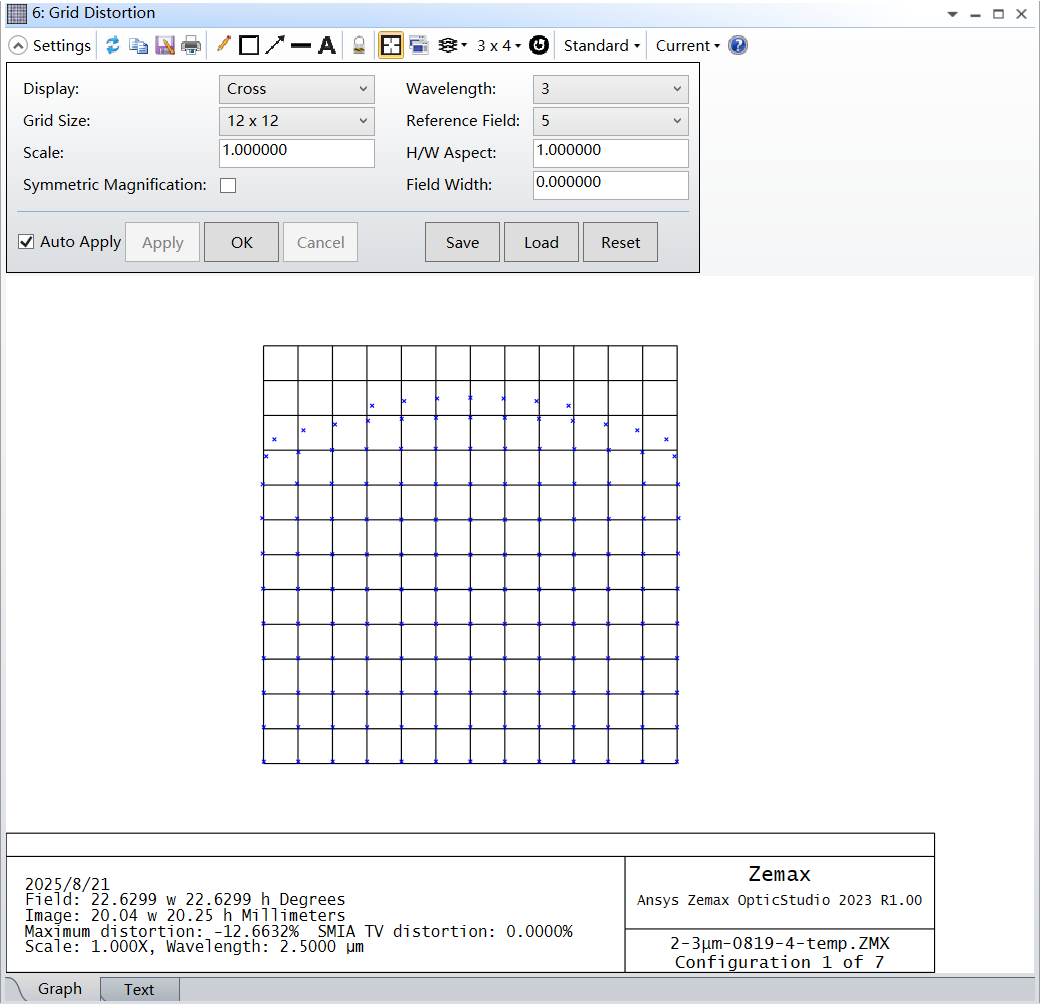
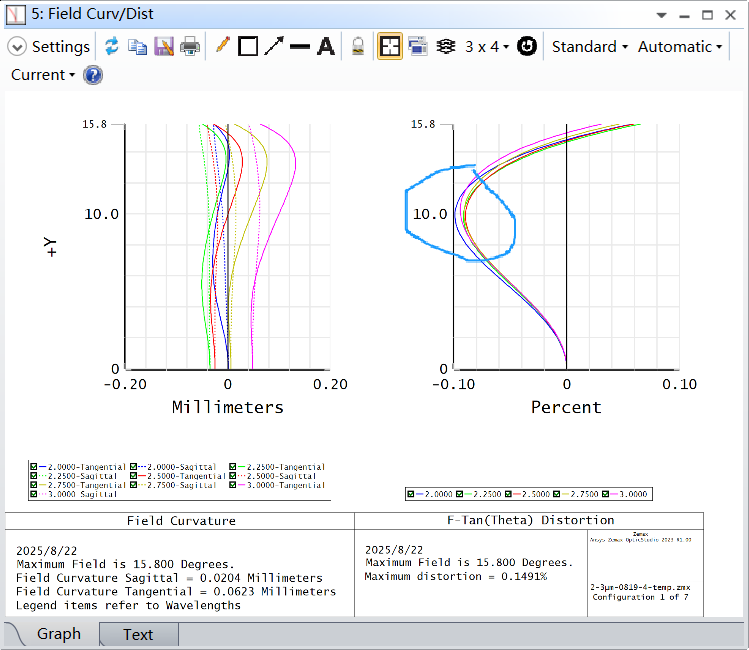
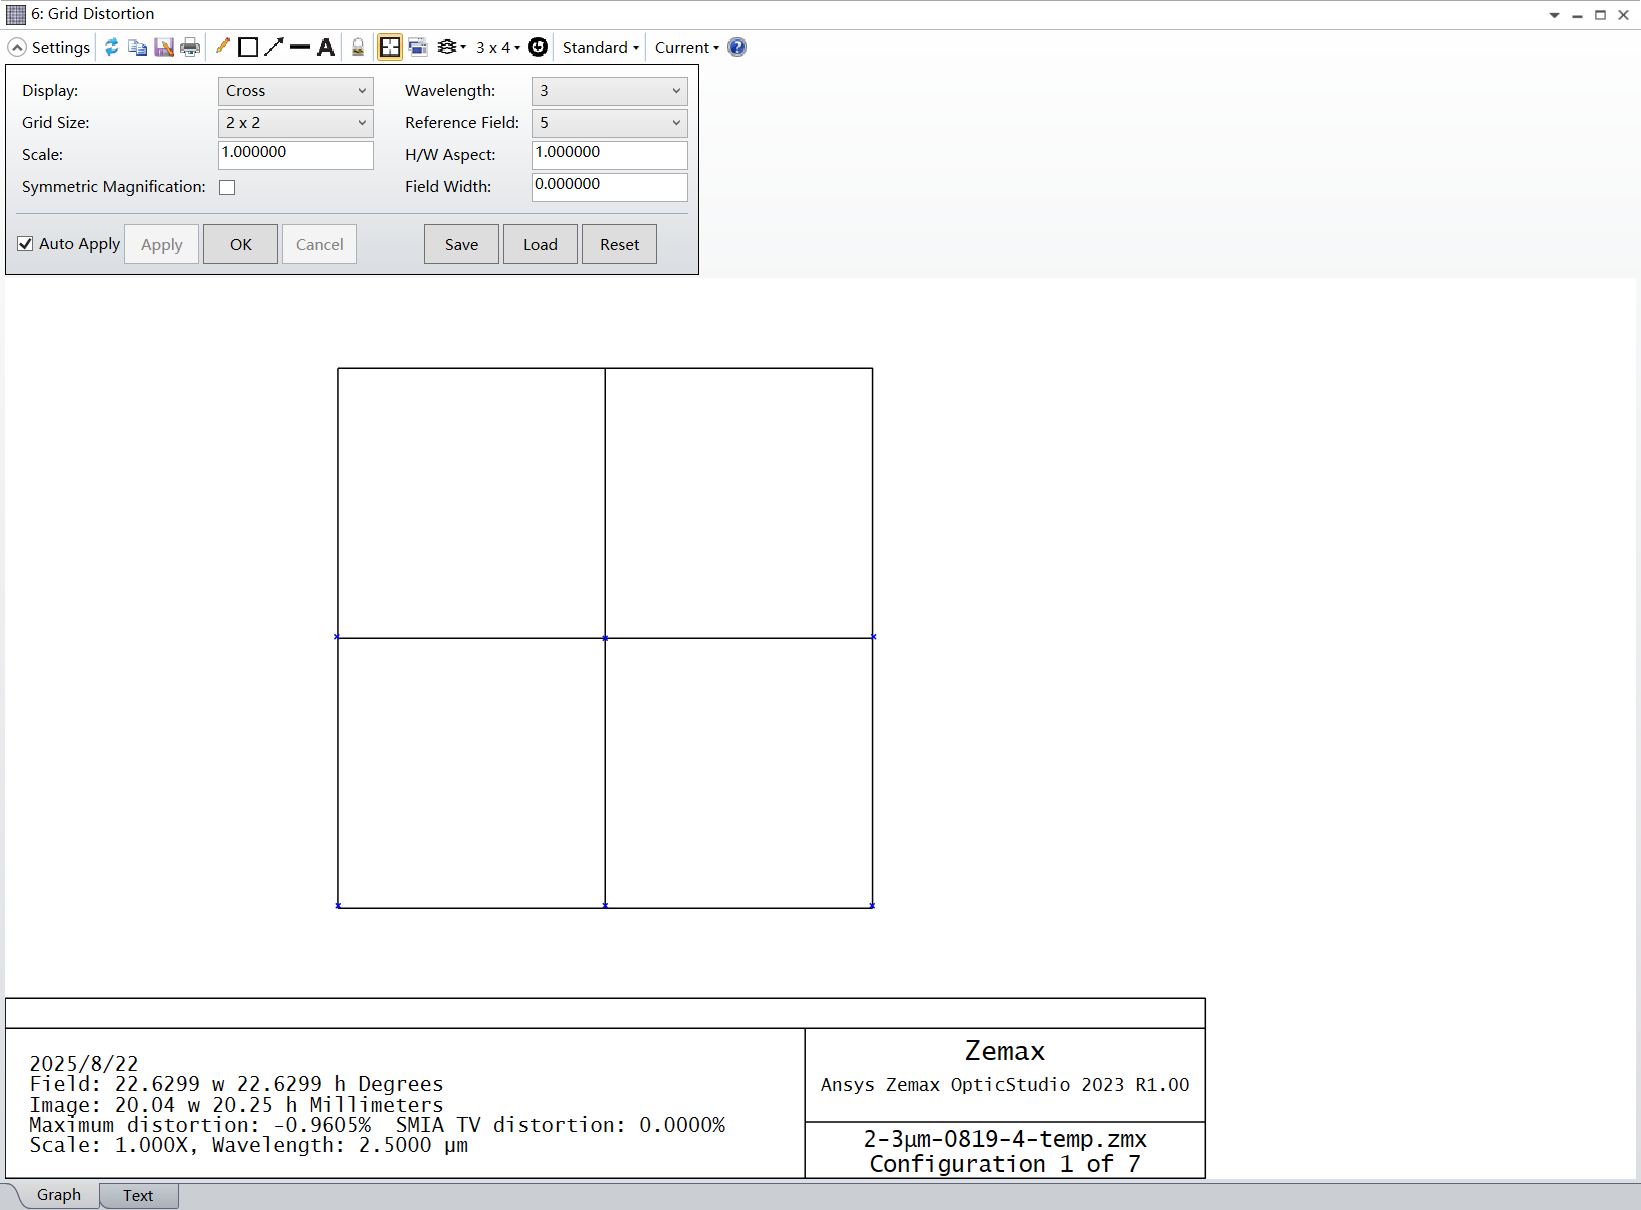
I believe that both analyses are actually in agreement & you should be primarily looking at the first Grid Distortion plot. If you consider the FC/D curves at the top, these are for point sources. So, when you define a field of 15.8°, you're only tracing this one exact field point. If you consider the extended source Grid Distortion, only the center point is at the exact field you defined; so if you move the Grid Distortion to Reference Field 5 and this is centered at 15.8°, then most of the points below the center line are within the defined field of view but the points above the center line are outside the defined field of view, especially those at the upper right and upper left corners.
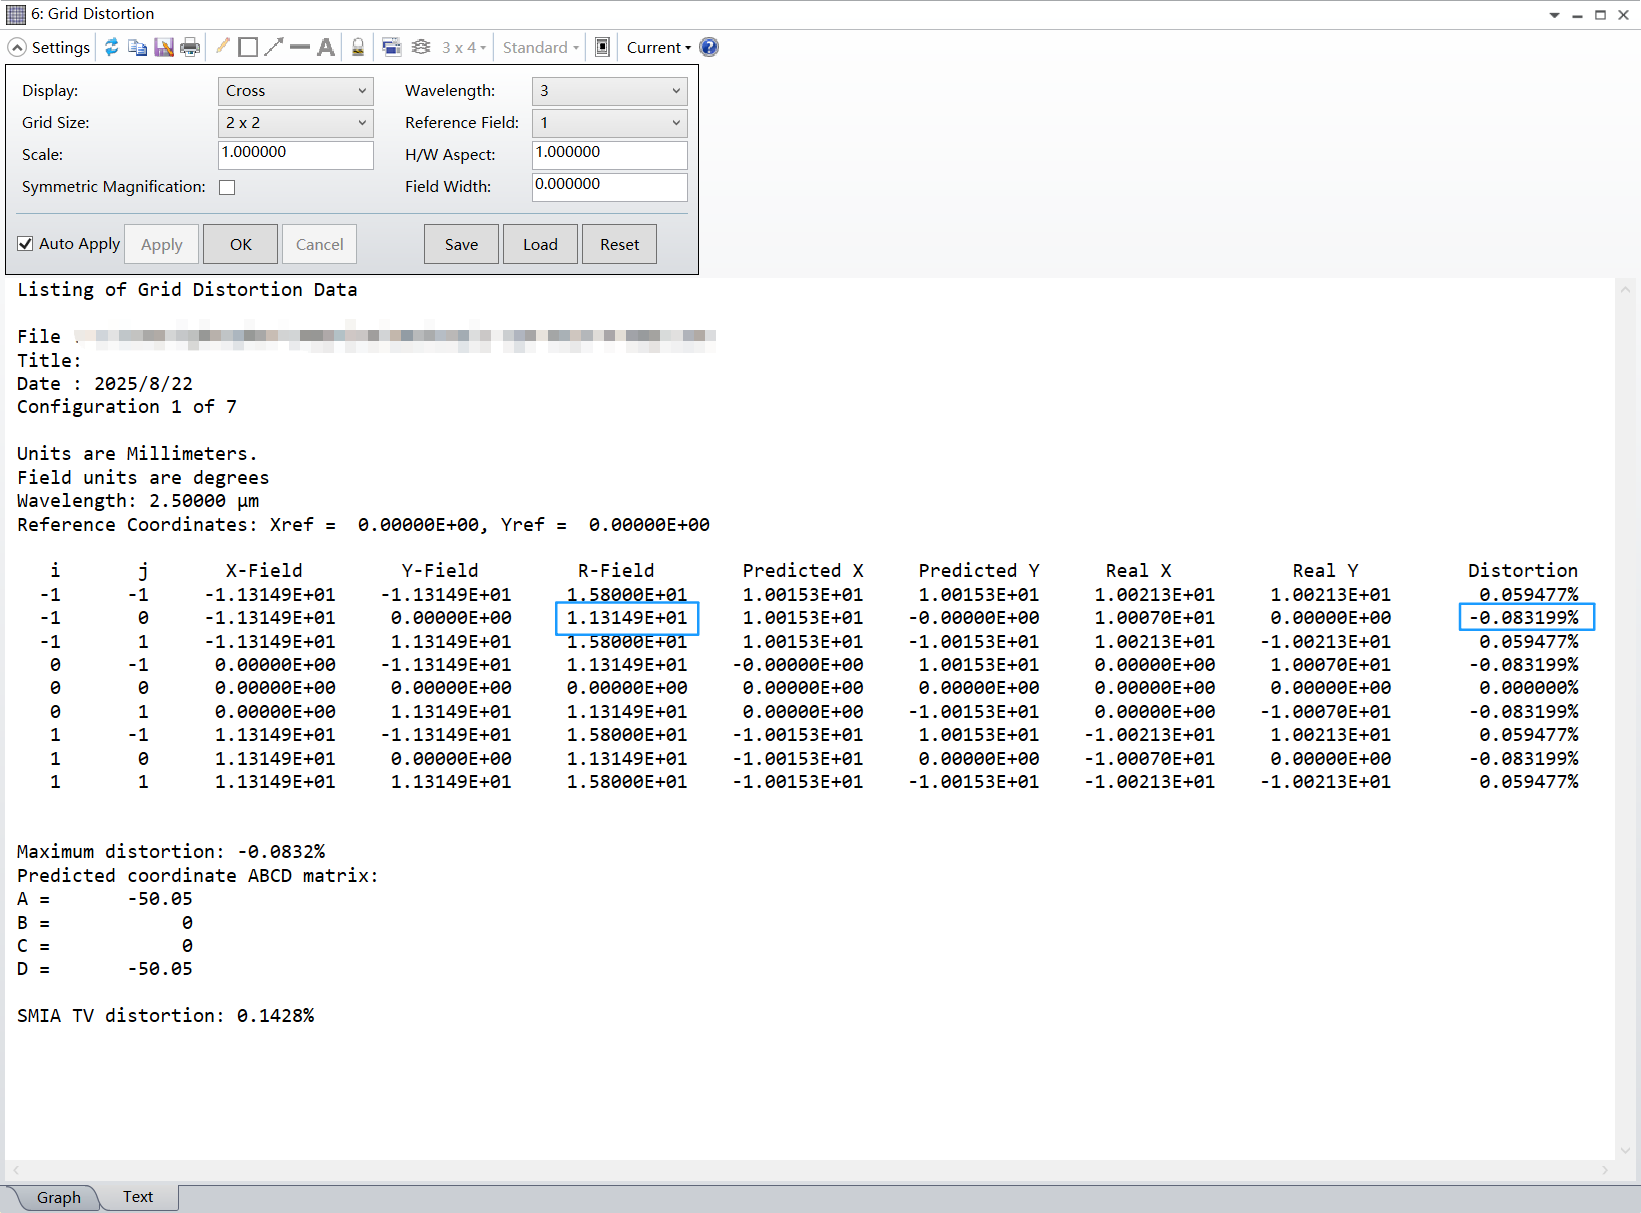
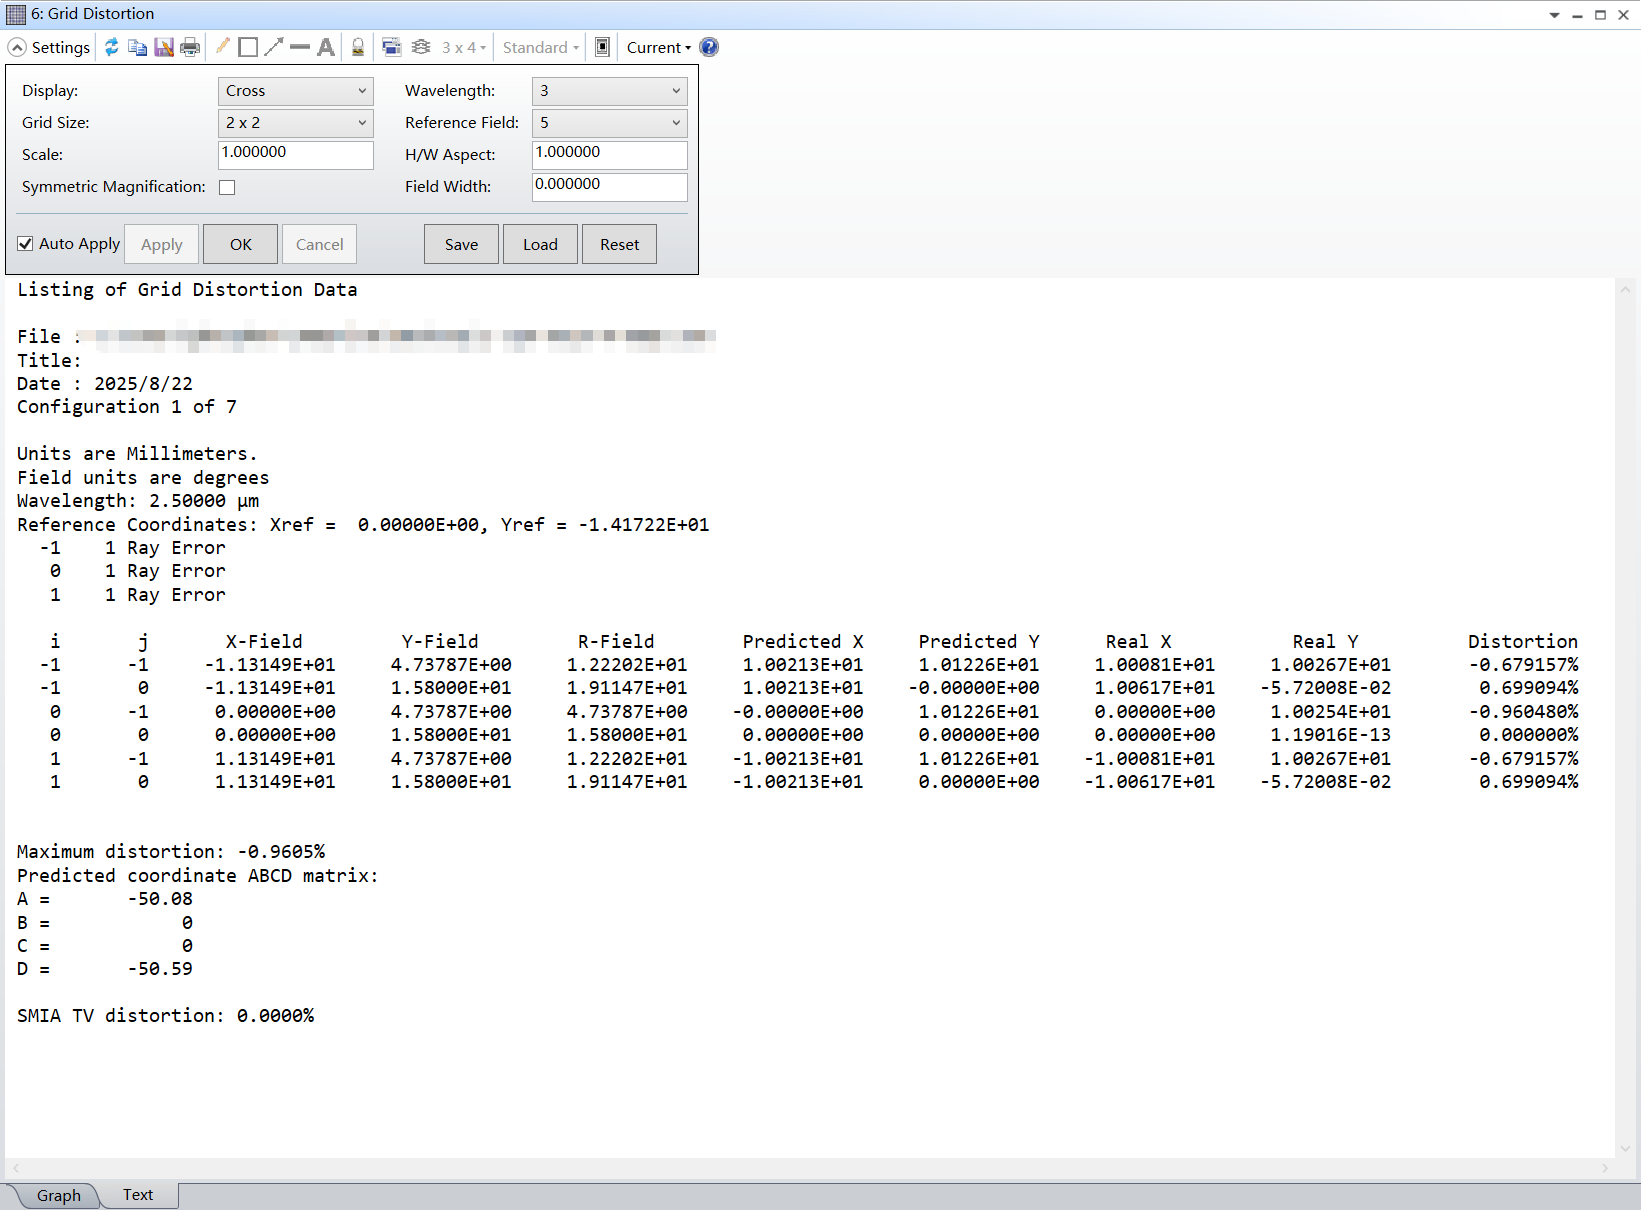
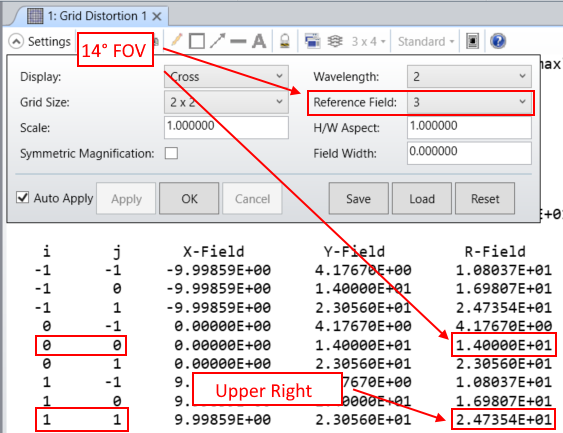
I would suggest dropping the Grid Size to 2 x 2, switch over the Text Tab and quickly investigate the R-Field (radial) input value. If I look at the Double Gauss 28 degree field.zmx from the Sample Files and select Reference Field of 3 (which corresponds to a radial FOV of 14°), the (i, j) of (0, 0) = 14.00° but the (i, j) of (1, 1) = 24.73° (a 176% greater FOV than defined in the Field Data Editor):
So, when analyzing the distortion performance, I would double check and verify the output results of your Grid Distortion and make sure the data points you're considering are valid and within the FOV you care about.-
August 22, 2025 at 3:33 am
2973391932
SubscriberI think I have a general understanding of your meaning: In the field curvature/distortion chart, the field of view from 0 degrees to 15.8 degrees is when the center of the object surface is on the optical axis, and the edge of the object surface is mapped to the image surface at a certain magnification, and the distortion values are calculated based on this, this corresponds to the case where the reference field of view in the grid distortion chart is selected as 0 degrees, and I have also verified this. Just as you said, the field of view at the location (i, j) with the maximum distortion value is exactly the same as the field of view angle in the field curvature/distortion chart. This is also consistent with the logic of taking photos: align the camera's optical axis with the center of the object to be photographed.

Then, when choosing the maximum field of view as the reference field of view for the grid distortion, as shown in the figure below, the three points at the top have deviated from the image plane because their field of view angle is much greater than 15.8 degrees. Therefore, these three points are not displayed in the figure, and there are no corresponding (i, j) coordinates in the document.
-
-
- You must be logged in to reply to this topic.
-
6450
-
1906
-
1457
-
1308
-
1022
© 2026 Copyright ANSYS, Inc. All rights reserved.


