-
-
December 12, 2024 at 10:24 pm
pavel.kirienko
SubscriberI have a 3D magnetostatic problem that involves a solenoid with a core. I want to visualize the B-field magnitude at a specific point as a function of the current through the coil. On top of that, I need the same except that instead of the B-field I need to sample a custom field computed with the field calculator.
I am able to sweep the current using Optimetrics, and I can also manually sample the field magnitude at the point of interest using a marker, but I don't understand how to make the marker value accessible to the report generator so that I can place both the current values from Optimetrics and the sampled magnitude from the marker on the same plot.
Can someone please advise? Thank you!
-
December 13, 2024 at 9:59 am
pavel.kirienko
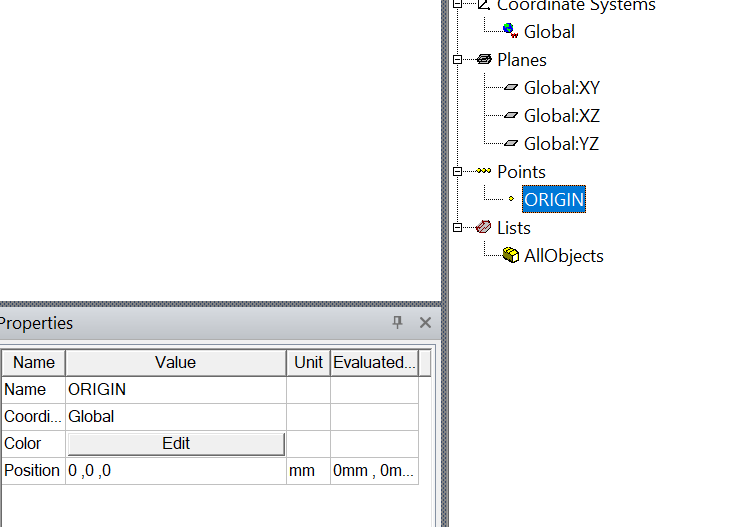
SubscriberOk I found the solution. You need to define the point of interest not as a marker, but as normal geometry (using the Draw menu). Say we call the point "ORIGIN":
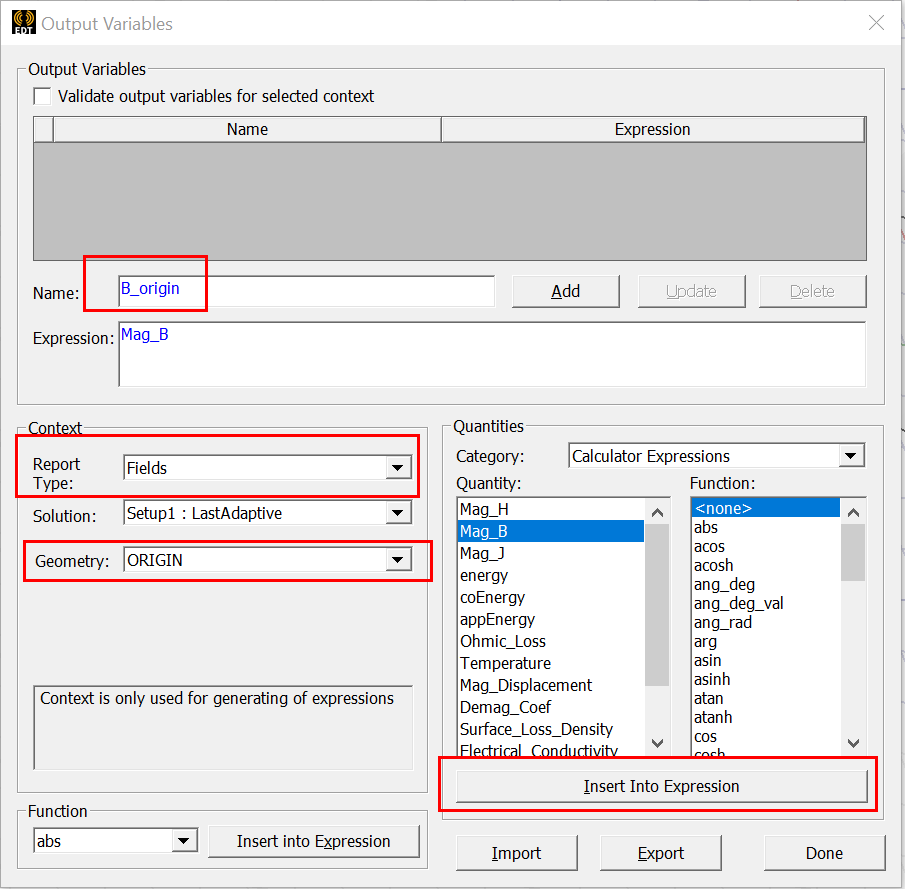
Then define a new output variable via the Results panel, where you can select which field to sample at the selected point:
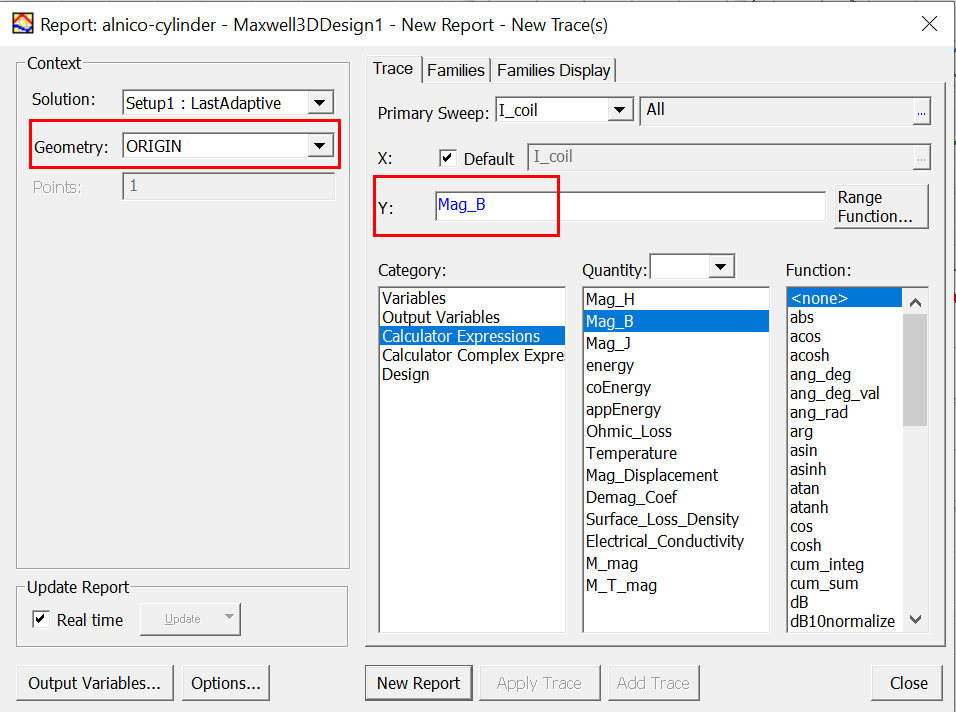
You can also directly use it in a Fields report:
-
- The topic ‘Plot a field magnitude as a function of an Optimetrics swept parameter’ is closed to new replies.


- Hfss 3D pcb via capped and filled with epoxy
- AEDT Natural Convection with default correlation is failing solver initializatio
- Three-Phase Voltage Imbalances in dual stator electric generator
- Calc Error in Field Calculator after PyAEDT Analyze
- Co-simulation in Q3D, Icepak – meshing problem
- Classic Icepak – clarifications on Boundary condition
- Link the Circuit to 3D Terminals
- Rectangular Coil in Maxwell for WPT using solid block
- Magnetic Dipole moment calculation
- Integration lines or U Axis Line for circular and rectangular ports

-
4512
-
1494
-
1386
-
1209
-
1021

© 2025 Copyright ANSYS, Inc. All rights reserved.


