-
-
November 7, 2024 at 9:53 am
Gabriele
SubscriberDear All,
I'm recently exploring Aqwa for diffraction analysis, and I'm currently using it through workbench (2024R1).
I'd like to get information on wave elevation at a specific point, and I think I could do it through field points.
I checked Aqwa manuals, but, although field points are mentioned, I could not find a place where it is described how to actually define a field point in the setting up of the model in workbench and how to actually use it.
Do you have any hint (manual place/video/etc.) that could guide me?
Thank you,
Gabriele
-
November 8, 2024 at 2:43 pm
Shuangxing Du
Ansys EmployeeIf you need the frequency domain wave elevations at specified points on the mean water surface after running the Hydrodynamic Diffraction analysis, it would be better to run a post processor, i.e. AqwaFlow (see AqwaFlow Manual).
-
November 8, 2024 at 4:57 pm
Gabriele
SubscriberDear Shuangxing Du,
thank you very much for the quick feedback.
Indeed, this is the type of information I was looking for.
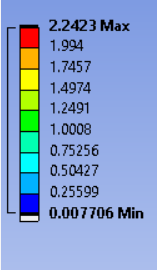
To get acquainted with the tool, I am now trying to cross-check the output from AqwaFlow with the graphical output that can be obtained from Hydrodynamic Diffraction => Solution => Max wave elevation
as, for a given point, the max wave elevation (incident+diffracted+radiated without 2nd order effects) is expected (at least, I expect it) to be equal to the amplitude from AqwaFlow.
I'm getting results that look consistent.
However, I have some issues in refining the visual comparison due to the fact that I do not find a way to modify the color scale that is automatically obtained in the graphica output:
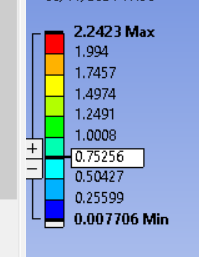
Clicking on the numbers, some boxes appear as if the levels were editable:
but, in reality, I cannot edit them / whatever I do is not reflected in the scale.
Right clicking on the scale shows also the possibility of changing the color scheme. However, even if I select a different colo scheme, the plot still uses the default rainbow.
Do you know whether there is a way to modify at least the min-max range of the color scale ?
Also, do you know whether it is possible to export the results from max wave elevation plot, or, in general, wave elevation data for the wave grid, in an external output file ?
Thank you,
Gabriele
-
-
November 11, 2024 at 12:31 pm
Mike Pettit
Ansys EmployeeHello,
The problem with changing the colour scale is a known issue - please try creating an environment variable ANS_USE_OPENGL_LEGEND_EDIT with the value of 1, restart Workbench, and try again.
For exporting: in Release 2024 R2, once the Pressures and Motions result has been evaluated, you should find an 'Export to CSV File...' option in the Details panel, which you can use to export all of the Wave Surface Elevation data into a text output file.
I hope this helps.
Mike
-
November 12, 2024 at 11:50 am
Gabriele
SubscriberHello Mike,
thanks for the reply.
I followed you indications, but, unfortunately, I could not make it working.
By adding the environmental variable, the scale can now be edited. However, the editing has no effect, as the scale keeps on being automatically adjusted by the software. Furthermore, also the color palette cannot be modified. Alternative color palettes are present through right-click menu, but selecting any of them as no effect.
Regarding the output in a CSV file, I tried to find the export option, but it does not seem to be there:
Best regards,
Gabriele
-
November 12, 2024 at 12:01 pm
Mike Pettit
Ansys EmployeeHello Gabriele,
I will investigate the colour scale problems further on my side, this looks like a bug. We use an Ansys toolbox for this part of the graphical processing, and there might have been some changes to the toolbox that have not been accounted for in our part of the software. I'm afraid you may be stuck with the existing behaviour for now.
For the CSV export option, please confirm which version of Ansys you are using? This was introduced in Release 2024 R2, so you might need to update your installation before you can make use of it.
Mike
-
-
November 12, 2024 at 12:25 pm
Gabriele
SubscriberHello Mike,
thank you for the consideration regarding the color scale matter.
Regarding exporting, it seems i'm lagging behind, because I'm using release 2024 R1 now. Then, it seems I need the update to follow your indication. To your knowledge, is there any alternative way in 2024 R1 to export the same data ?
Best regards,
Gabriele
-
November 12, 2024 at 1:43 pm
Mike Pettit
Ansys EmployeeHello Gabriele,
I'm afraid not, but you can certainly use AqwaFlow as an alternative, as Shuangxing suggested.
If you want to get wave properties over the same positions as the wave grid in Aqwa Workbench, you can find the grid parameters in the Aqwa input file, located in the Hydrodynamic Diffraction solver files directory (usually e.g. project_files\dp0\AQW\AQW\AQ\Analysis\Analysis.dat). In there you should find an entry like:
SEAG (81, 51, -40., 40., -25., 25.)which is the number of coordinates in X and Y directions; min X, max X, min Y and max Y. Then you need to create an AqwaFlow input file (.cor) to match this grid, which may be easiest by writing a simple Python script or similar. In this example the .cor file would contain 4,131 points at equally-spaced positions from [-40, -25] to [40, 25] with 1 m spacing. After running AqwaFlow, you could parse the output with another Python script to retrieve the specific information for need.
Mike
-
-
November 12, 2024 at 2:03 pm
Gabriele
SubscriberHello Mike,
actually my original intention was also to get acquainted with the code, comparing aqwaflow outputs with results from the workbench interface.
Therefore, using aqwaflow to extract the data is not the way to go for this purpose.
But thanks anyway for your feedback, because it seems it is the way to go to get those data out from 2024 R1 workbench.
Best regards,
Gabriele
-
- You must be logged in to reply to this topic.


-
4703
-
1565
-
1386
-
1242
-
1021

© 2025 Copyright ANSYS, Inc. All rights reserved.


