TAGGED: boundary-conditions, fluent, static-pressure, total-pressure
-
-
July 15, 2024 at 8:42 am
xukai214
SubscriberWhen I use Ansys Fluent to calculate the total pressure drop between the inlet and outlet, I meet some questions.
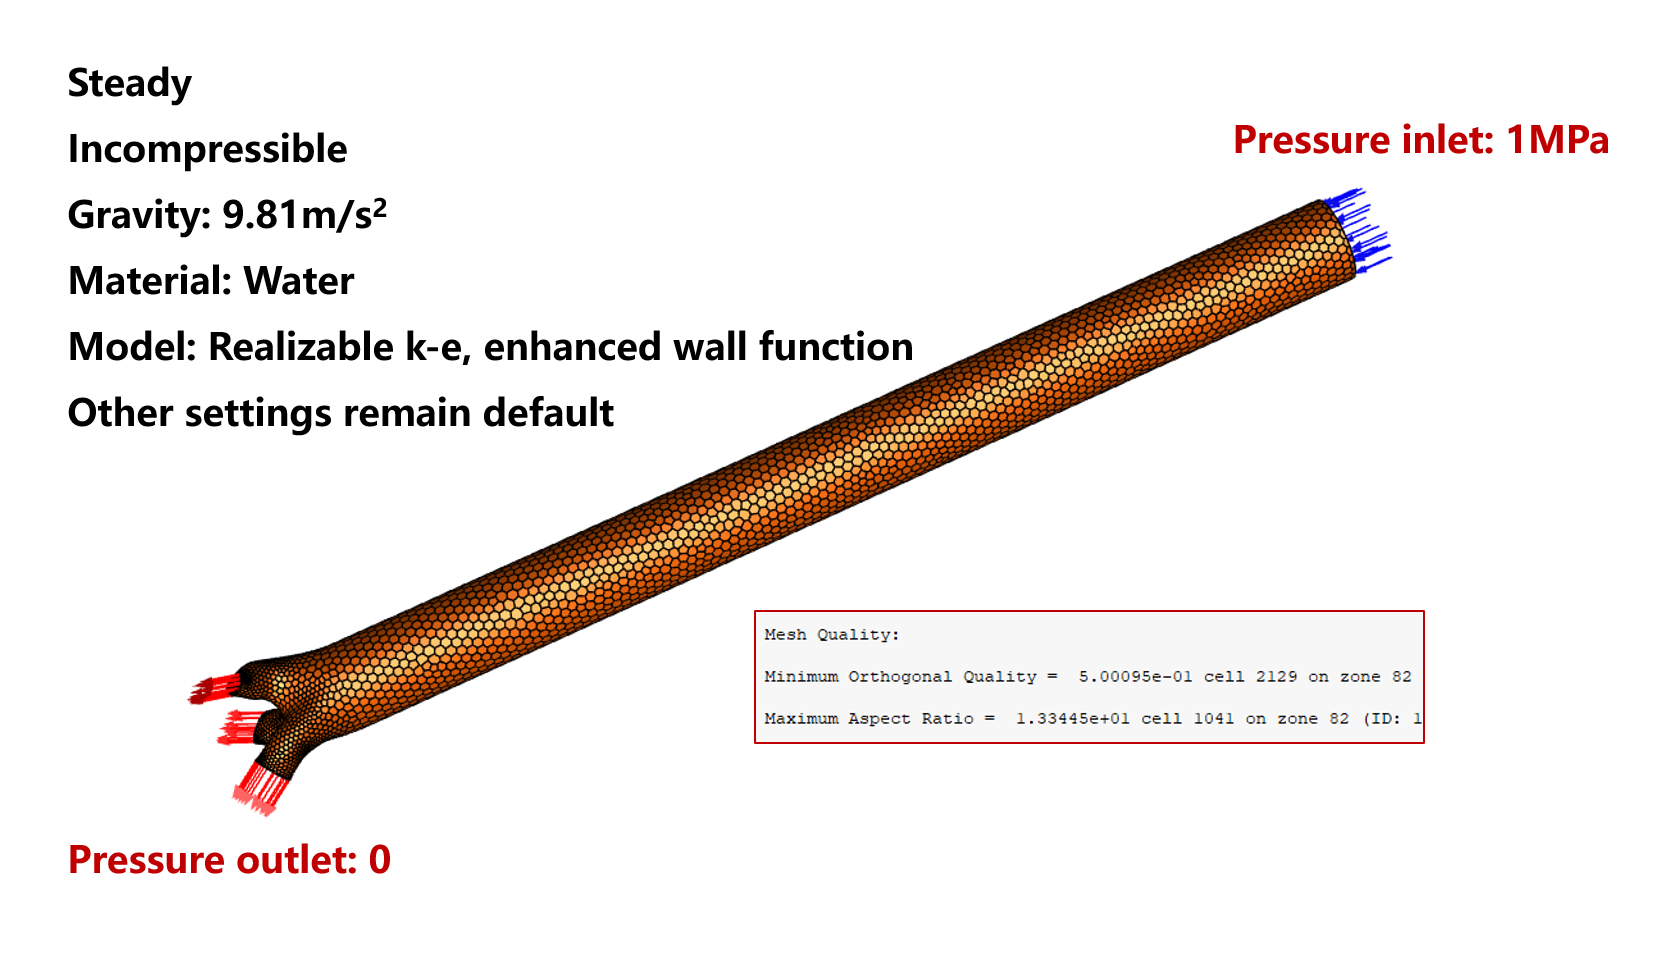
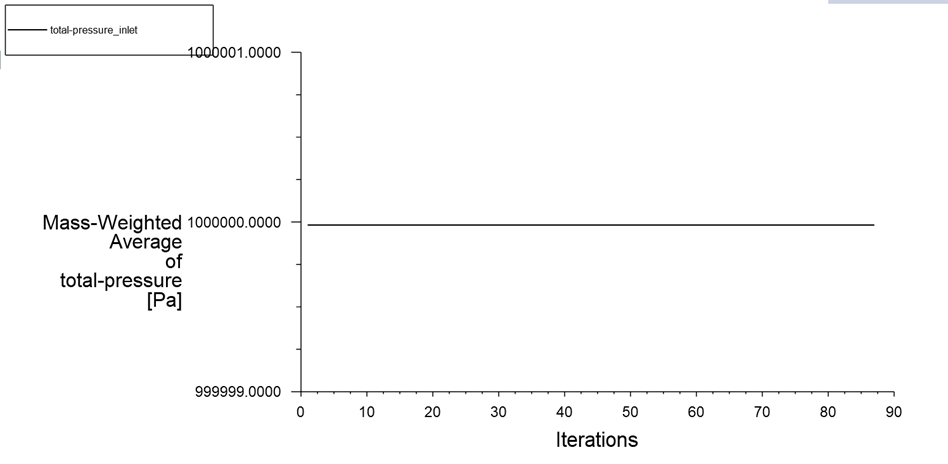
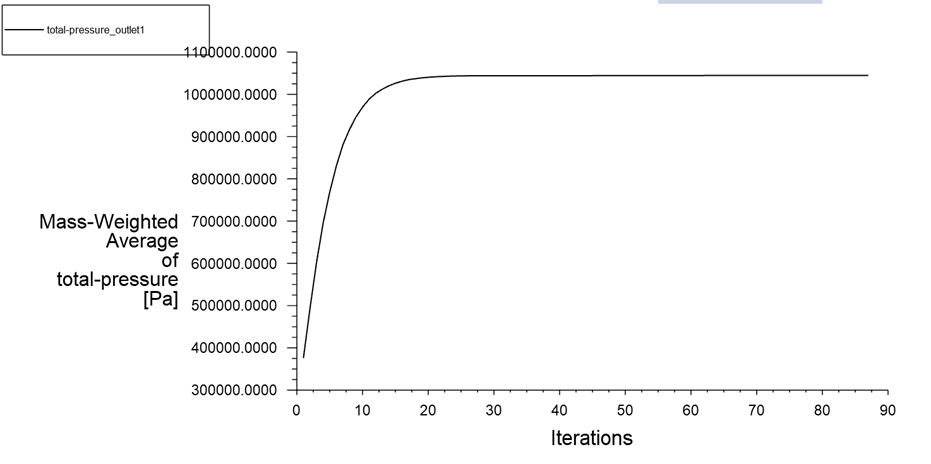
1. I use Mass-Weighted Average Method to check the pressure at the inlet and outlet after the calculation. However, total pressure at the outlet is higher than the inlet and this is impossible. (The settings of Fluent is shown in Figure 1.) I change the surface integrals to Area-Weighted Average or Facet Average, the problem is still exists.
2. I think the total pressure at the outlet is equal to dynamic pressure because the static pressure is zero. However, further research have found that there is a big difference between total pressure and dynamic pressure. When I export the ASCII files of total pressure, dynamic pressure and static pressure, the total pressure is still not equal to the sum of the static pressure and dynamic pressure at the outlet. So I think this problem is not caused by the types of surface integrals.
I want to know why total pressure of the outlet is higher than the inlet? Why total pressure is not equal to the sum of static pressure and dynamic pressure when I use pressure outlet boundary condition at the outlet?
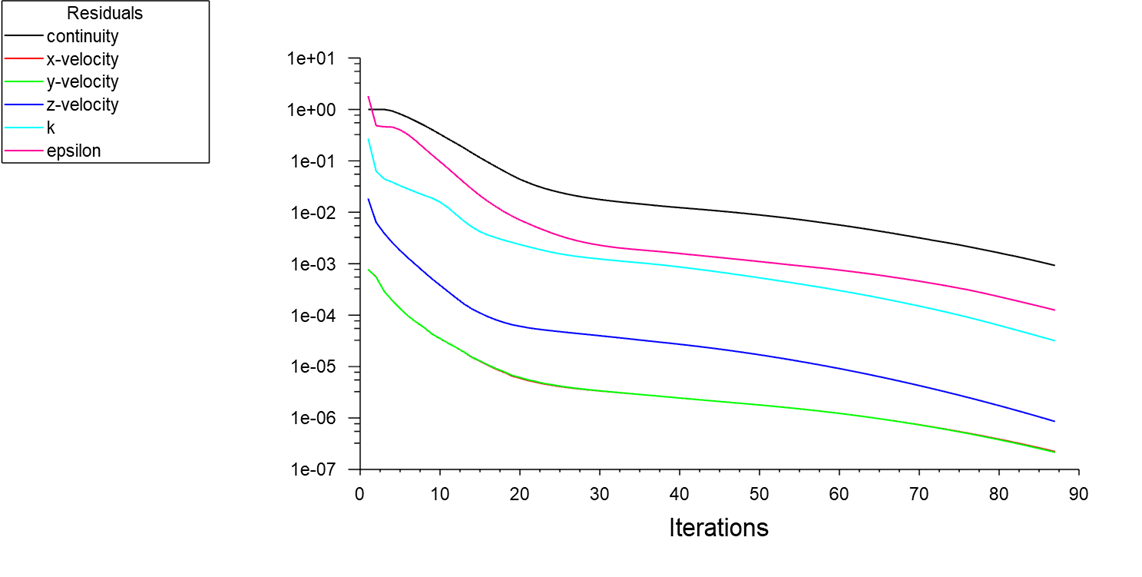
(Notes: The caculation is converged after 87 iterations. The detailed settings of fluent are shown below)
Figure 1 The settings of Fluent
Figure 2 The convergence of the calculation
Figure 3 The pressure of the outlet
-
July 15, 2024 at 12:35 pm
Rob
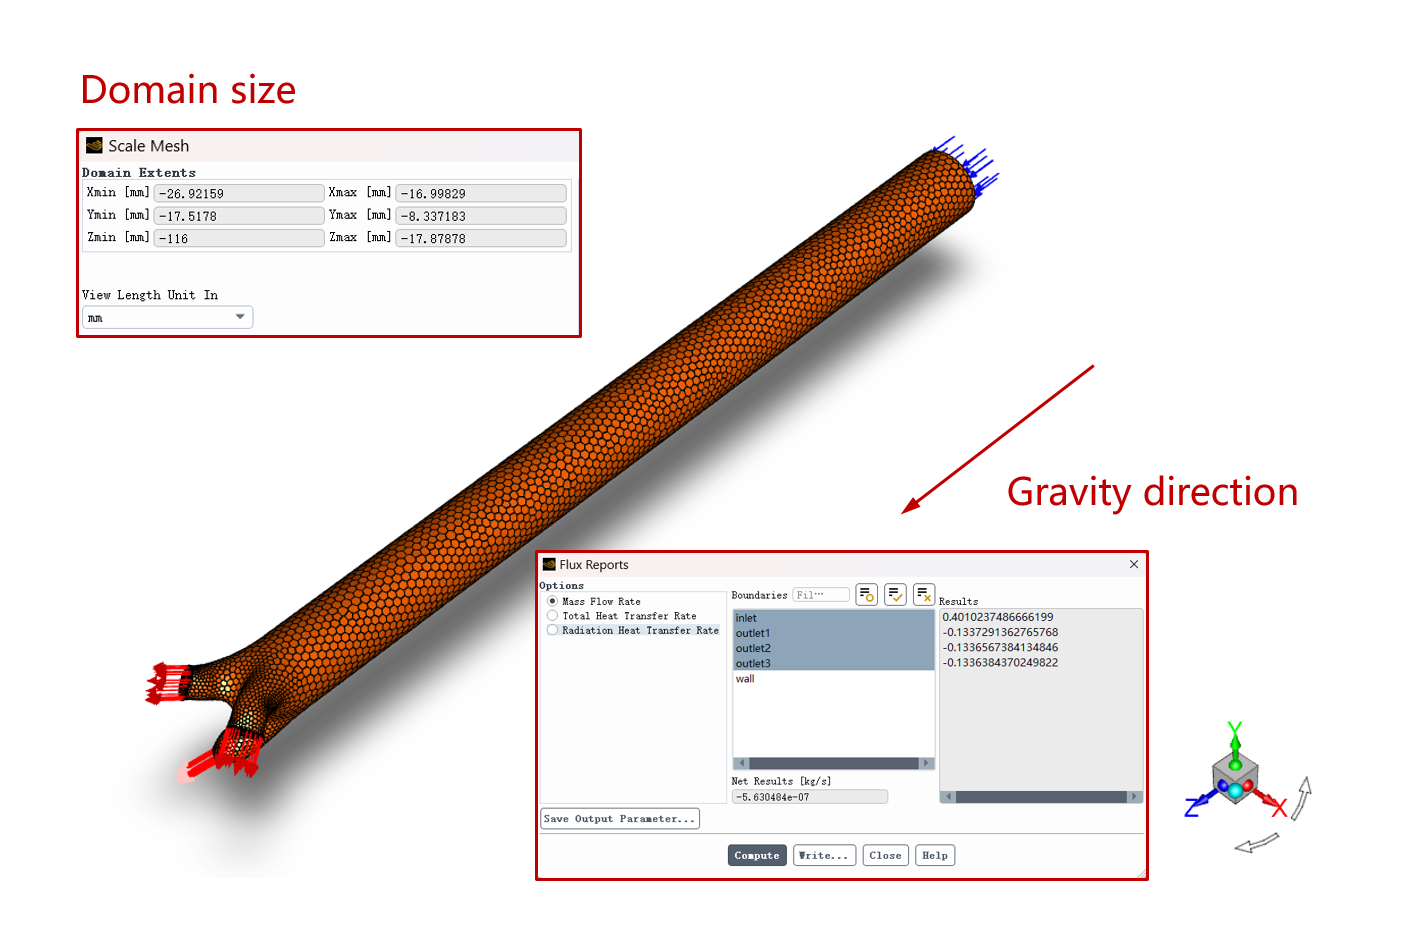
Forum ModeratorCheck mass flux too - does in and out balance? Which direction is gravity, and what is the domain size?
-
July 15, 2024 at 2:39 pm
-
-
July 15, 2024 at 3:07 pm
Rob
Forum ModeratorHow does the pressure compare on each outlet? What is the mass average velocity on inlet & outlet?
Can you check what hydrostatic pressure would be over the domain?
-
July 16, 2024 at 1:10 am
xukai214
SubscriberThe pressure between the different outlets is almost the same. (Show in Figure 4) The velocity magnitude of inlet is around 10m/s and outlets is 43.6m/s. The mass average velocity on inlet and different outlets is shown in Figure 5.
Figure 4 The pressure of different outlets
Figure 5 The mass average velocity on inlet and outlets
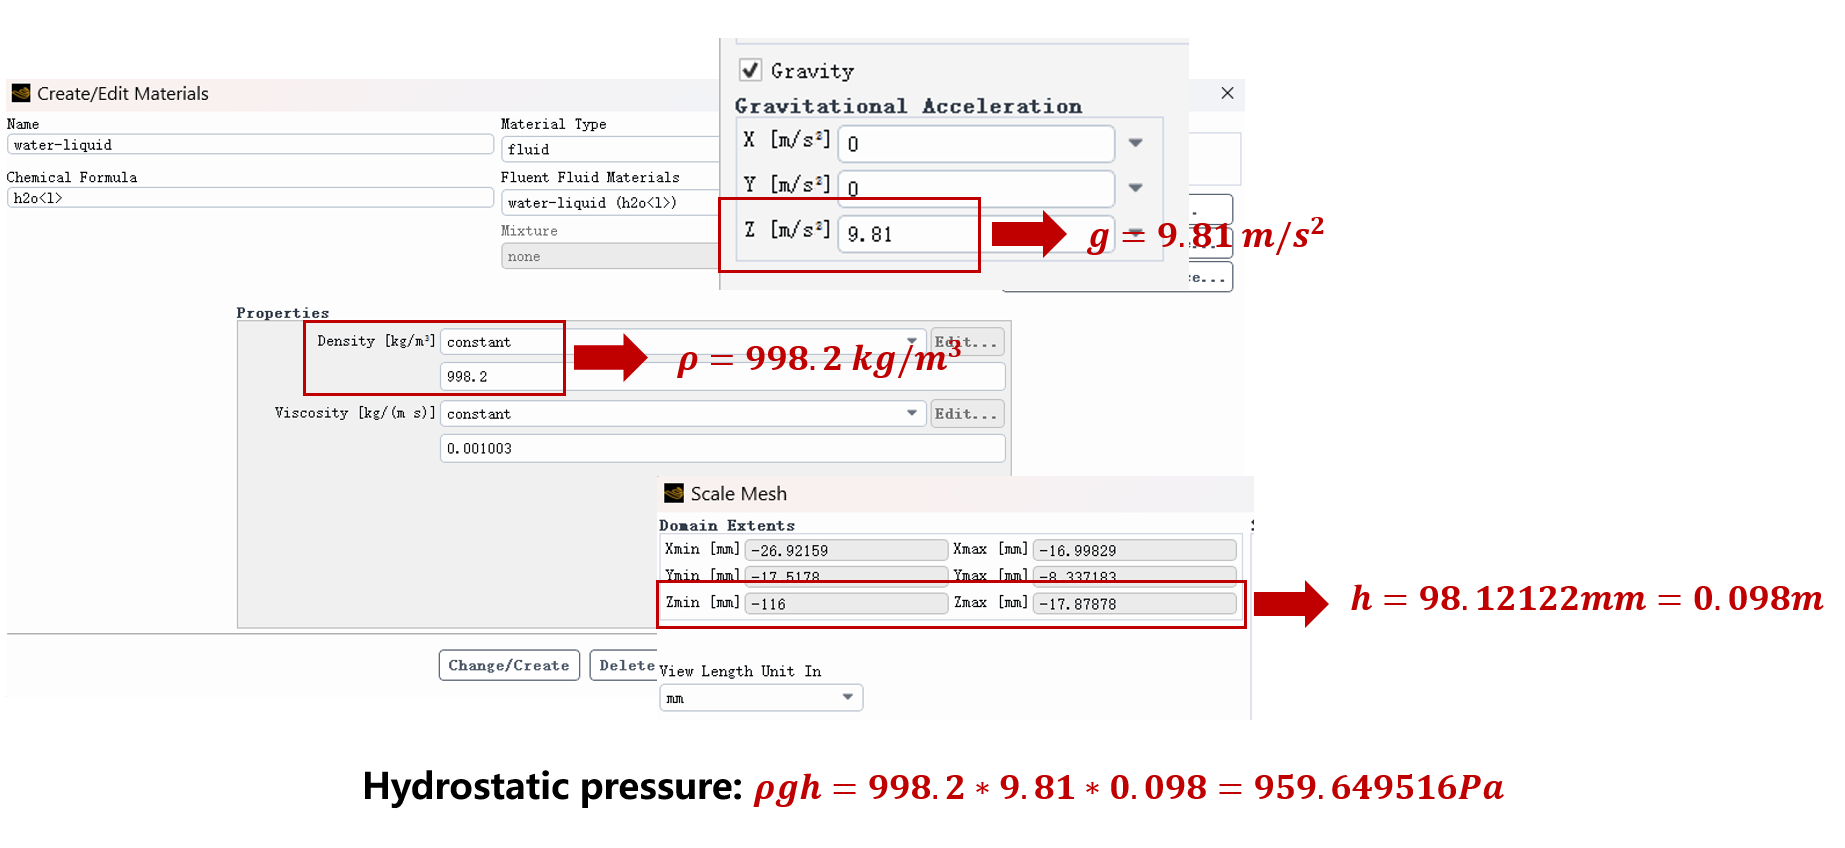
We use equation in Figure 6 to calculate the hydrostatic pressure, the value is 959.65Pa. Previously, we compared calculations with gravity on and off and the results do not show a significant difference. So we think hydrostatic pressure is not the main reason of the problem.
Thanks again for your reply and look forward to hearing new from you!
Figure 6 The calculation of hydrostatic pressure
-
-
July 16, 2024 at 1:07 am
xukai214
SubscriberI am confused by this problem and hope there are more people involved in the discussion.
-
July 16, 2024 at 1:36 pm
Rob
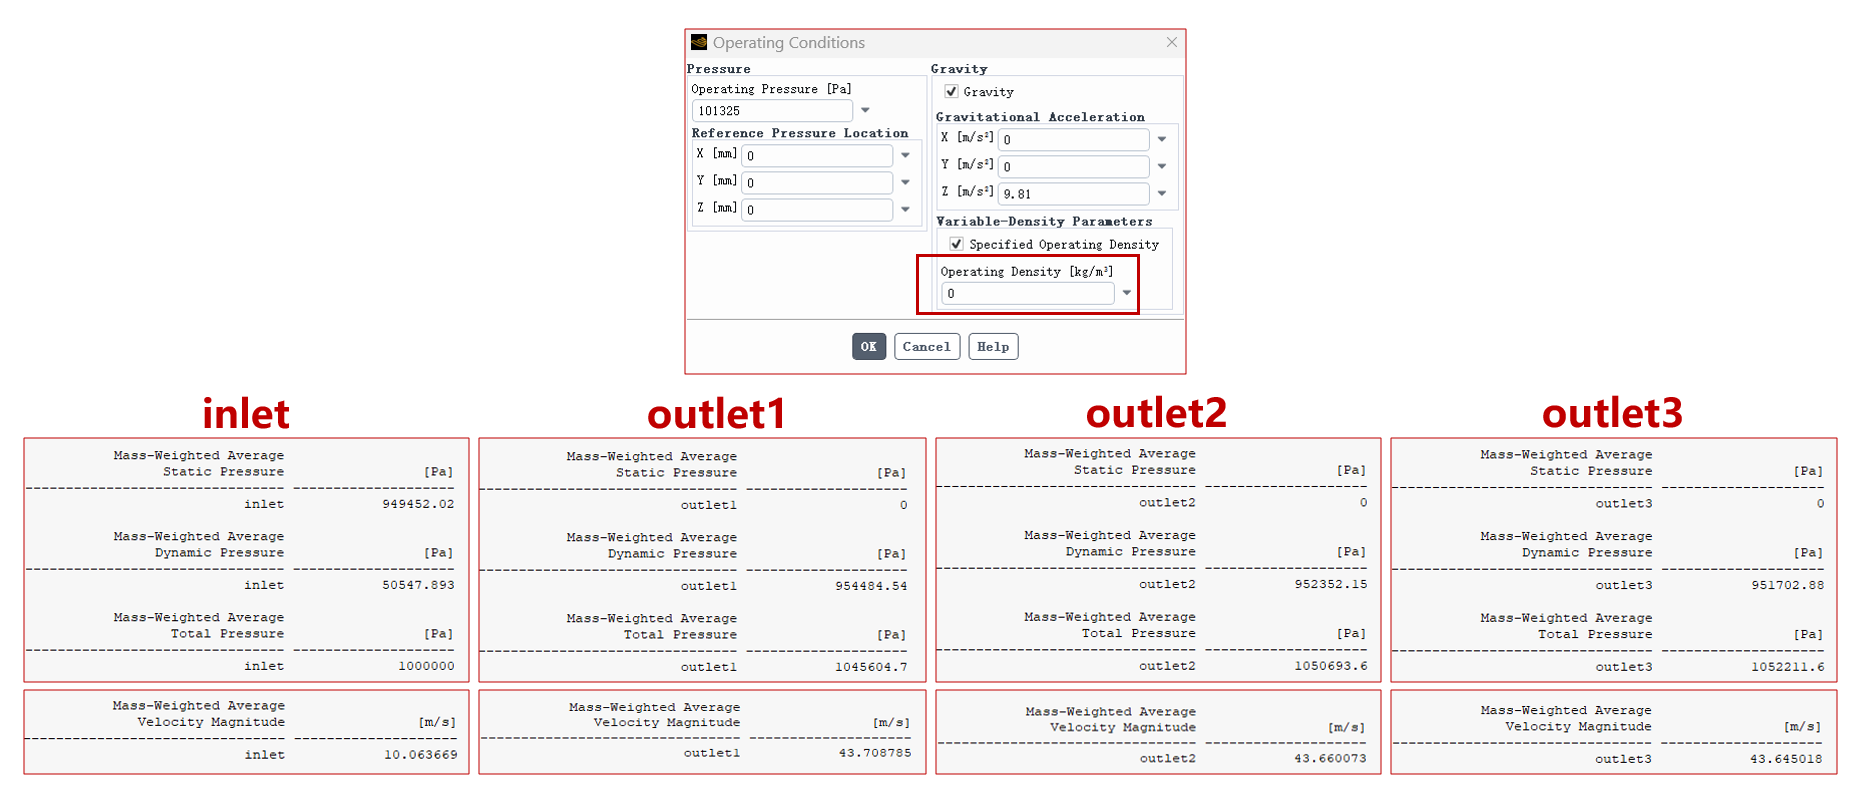
Forum ModeratorCan you set the operating density as zero and run on. Then report the static, dynamic & total pressure along with velocity on the 4 boundaries.
-
July 16, 2024 at 2:29 pm
xukai214
SubscriberThank you for your advice. I have set the operating density as zero and run on the calculation. The static, dynamic and total pressure along with velocity on the 4 boundaries are shown in Figure 7. The above settings seem not to work and problems remain unresolved.
Figure 7 The static, dynamic and total pressure along with velocity on the 4boundaries.
-
-
July 16, 2024 at 3:58 pm
Rob
Forum ModeratorHave you got any backflow warnings from the solver?
-
July 17, 2024 at 12:19 am
xukai214
SubscriberThere were no backflow warnings throughout the calculation.
-
-
July 19, 2024 at 10:55 am
Rob
Forum ModeratorHmm, my post's not appeared.
Please can you check area weighted pressure? You may also need to converge further as the differences relative to the total values are small.
-
July 24, 2024 at 1:29 am
xukai214
SubscriberFirst, as I have mentioned at the begining "I change the surface integrals to Area-Weighted Average or Facet Average, the problem is still exist." and "When I export the ASCII files of total pressure, dynamic pressure and static pressure, the total pressure is not equal to the sum of the static pressure and dynamic pressure at the outlet. So I think this problem is not caused by the types of surface integrals."
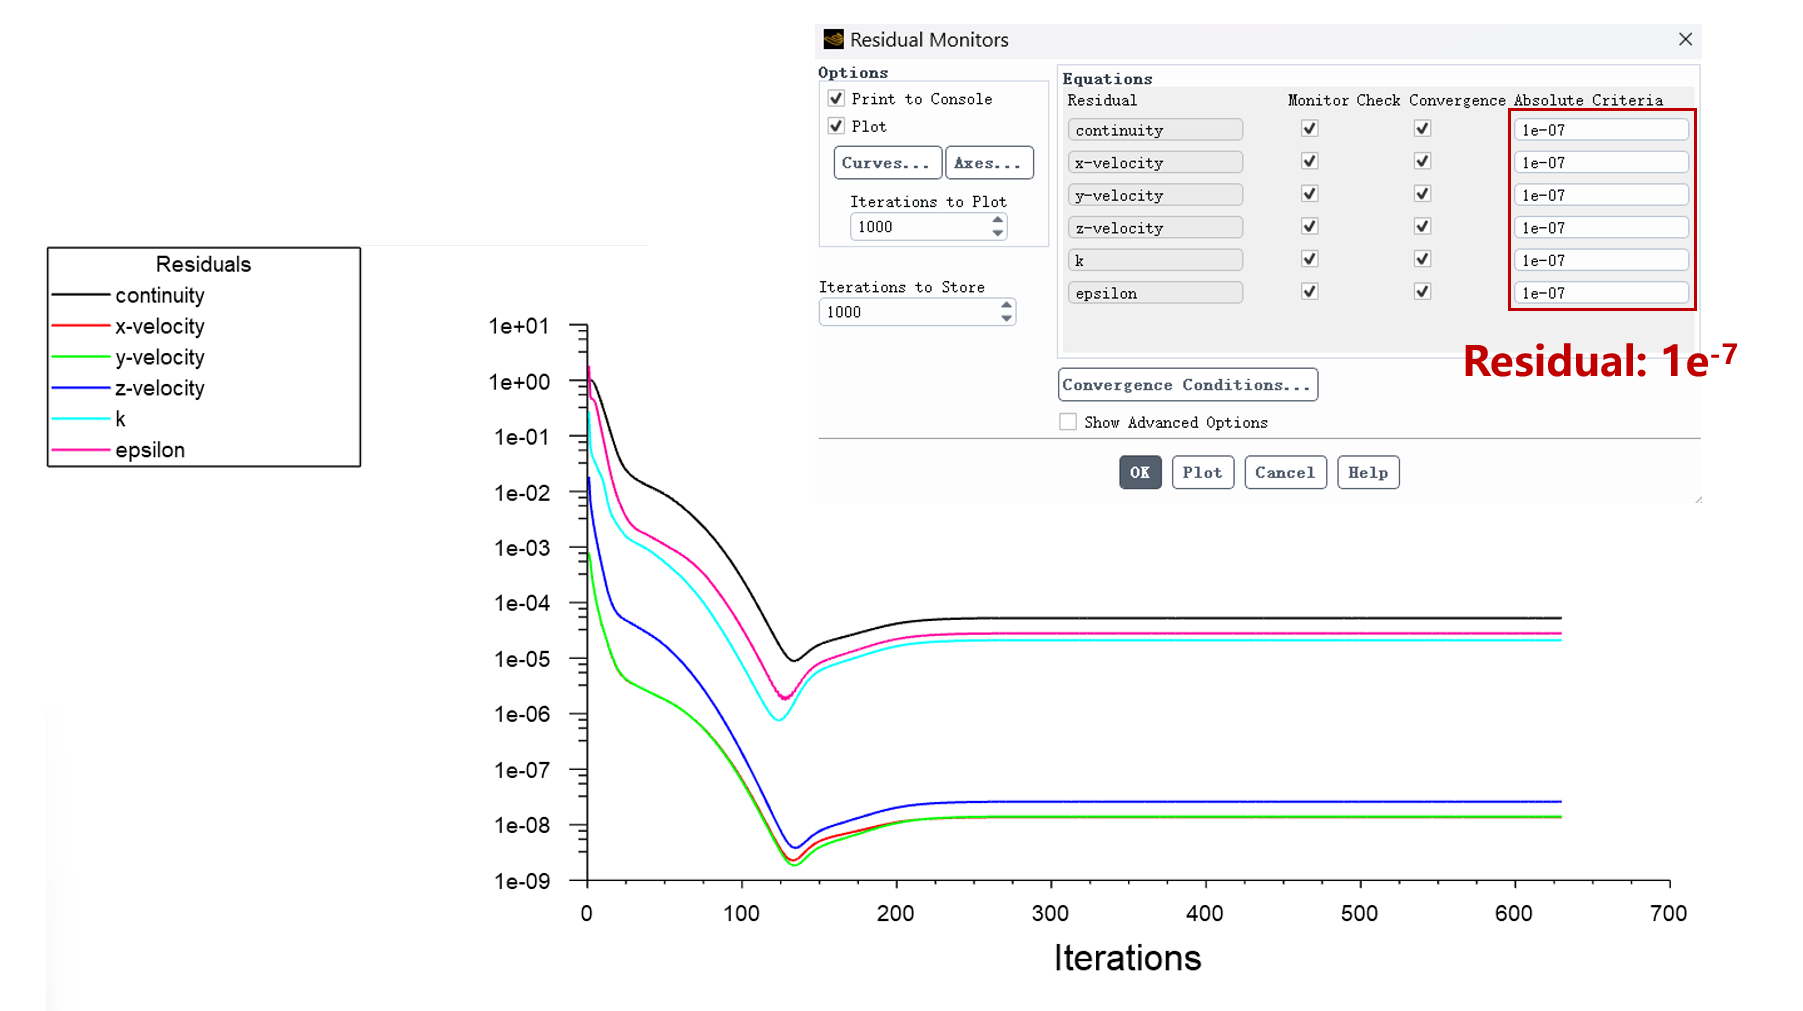
Second, according to your advice I set the residual to 1e-7 run on the calculation and there is a problem. The calculation converge only to 1e-4 (Show in Figure 8). Does this the main reason of the problem? What should I do to improve it?
Figure 8 The convergence of the calculation
-
-
July 24, 2024 at 2:53 pm
Rob
Forum ModeratorOn a slightly not converged test it's an effect of the averaging. Check a custom field function that's the sum of static + dynamic pressure. Then run the averaging on that. There are all sorts of things going on at the boundaries as flow sorts itself out.
-
July 25, 2024 at 1:34 am
xukai214
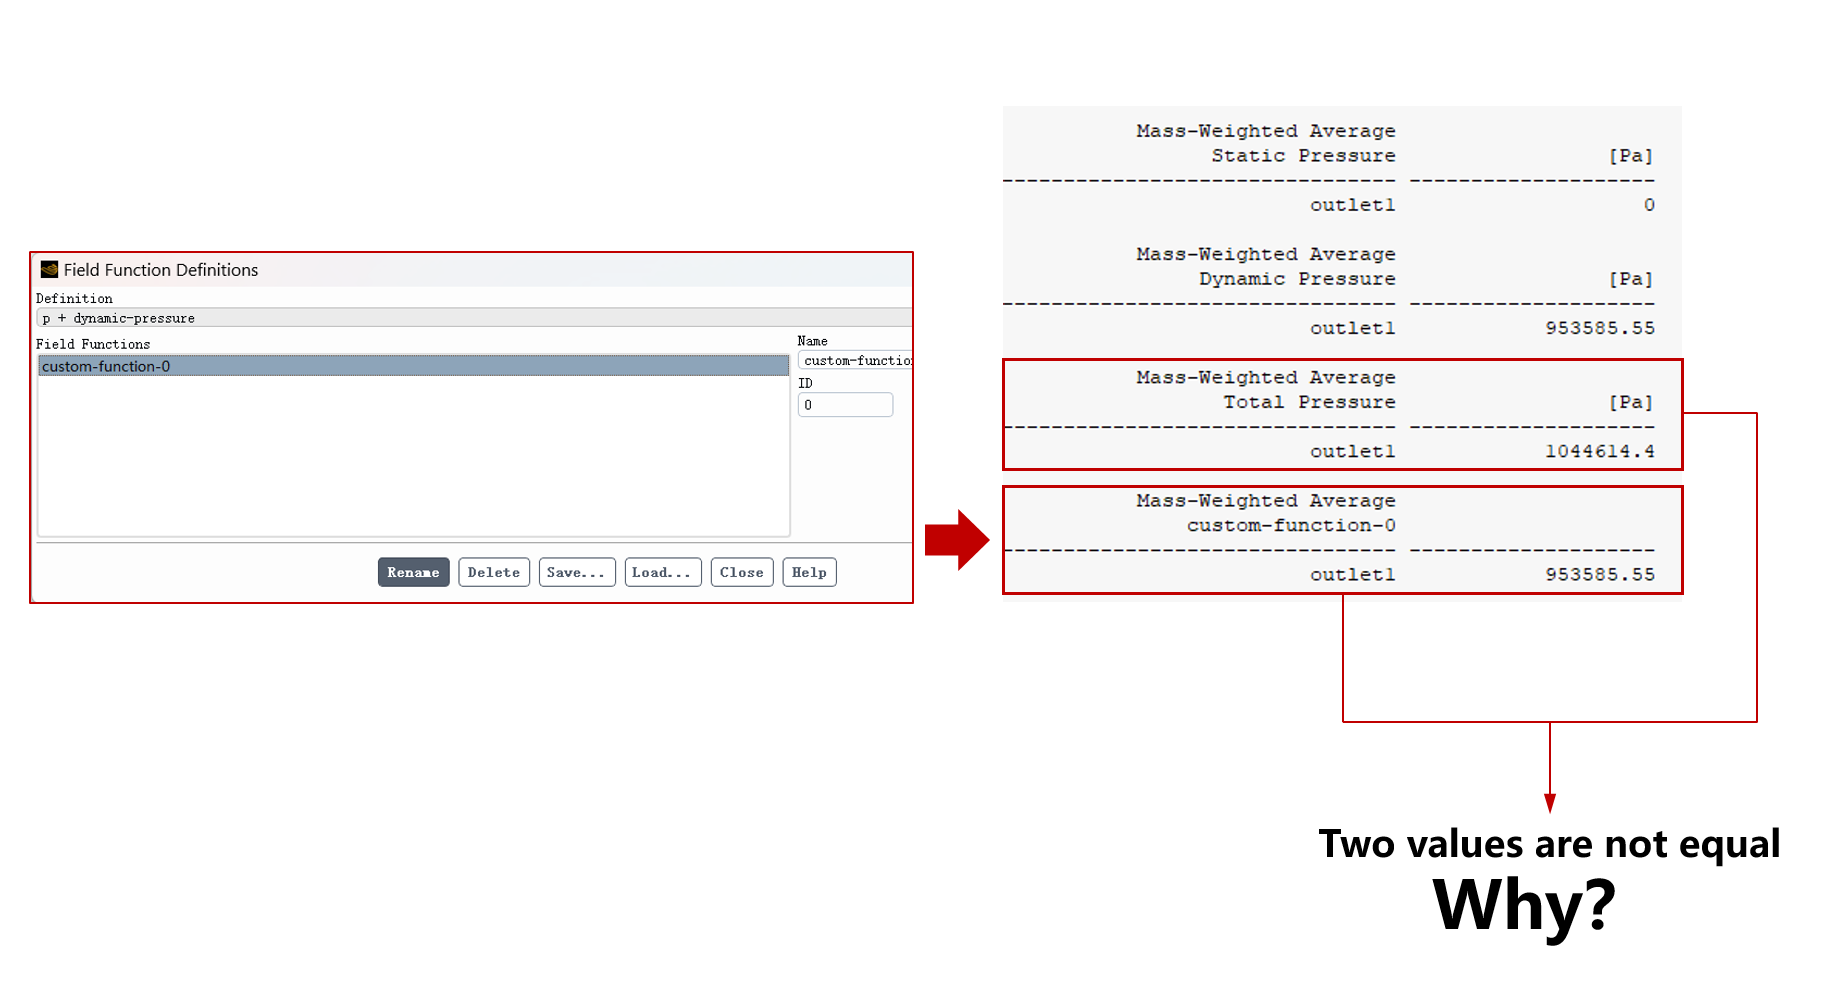
SubscriberHmm, I have created a new variable custom-function-0 equal to the sum of static + dynamic pressure. When I report it using surface integrals the problems are still exist (Show in Figure 9). Custom-function-0 is not equal to total pressure in surface integrals, why?
Figure 9 The setting of custom field function
Until now, my problems have not been solved and I think you may have forgotten my original questions. So I think it is necessary to emphasise that my questions are why total pressure of the outlet is higher than the inlet? Why total pressure is not equal to the sum of static pressure and dynamic pressure when I use pressure outlet boundary condition at the outlet?
-
-
July 25, 2024 at 10:25 am
Rob
Forum ModeratorOK, on my test case which has smooth flow gradients at each end (ie no change in diameter, flow direction etc) all is as expected. So, there now must be something in your flowfield or model that's not behaving, or rather is messing with the post processing. So far you've not shown any plots of any field variables so diagnostics are nigh impossible.
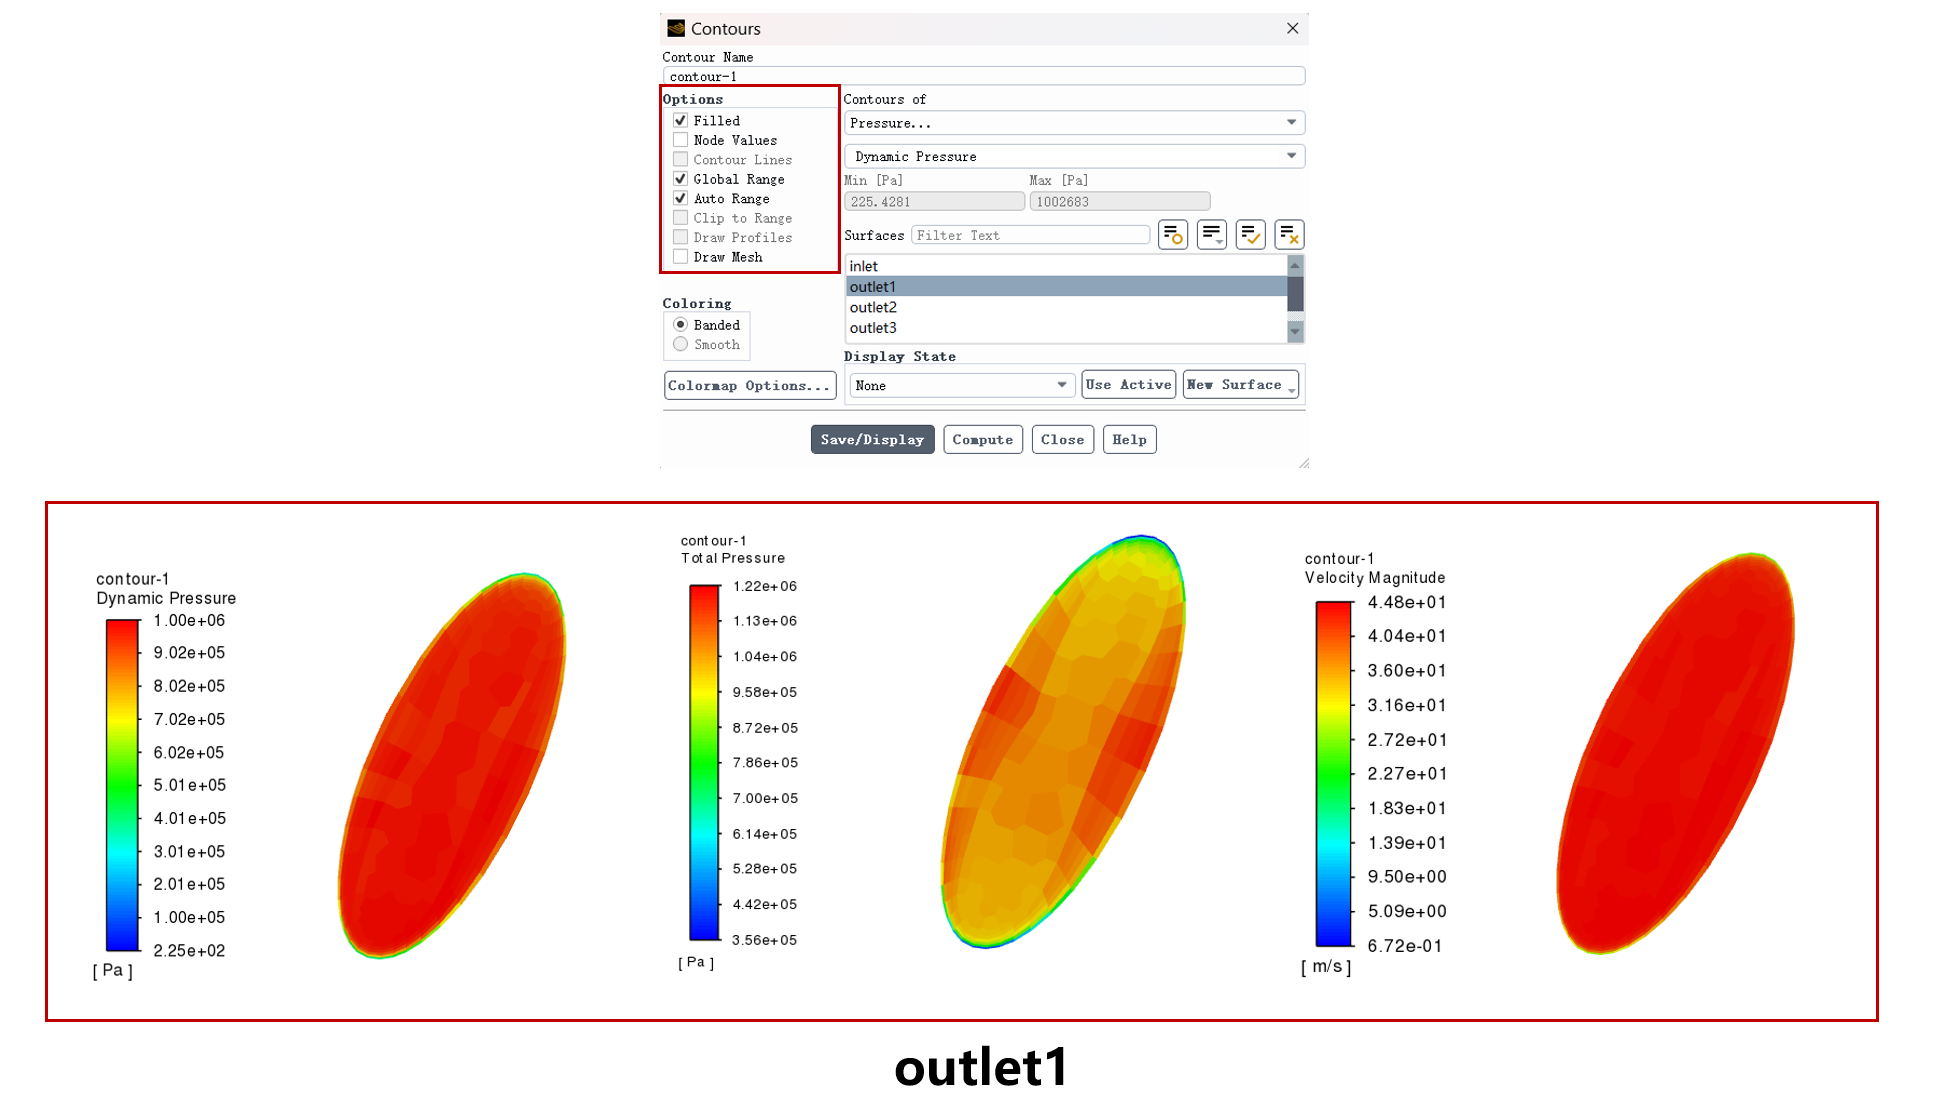
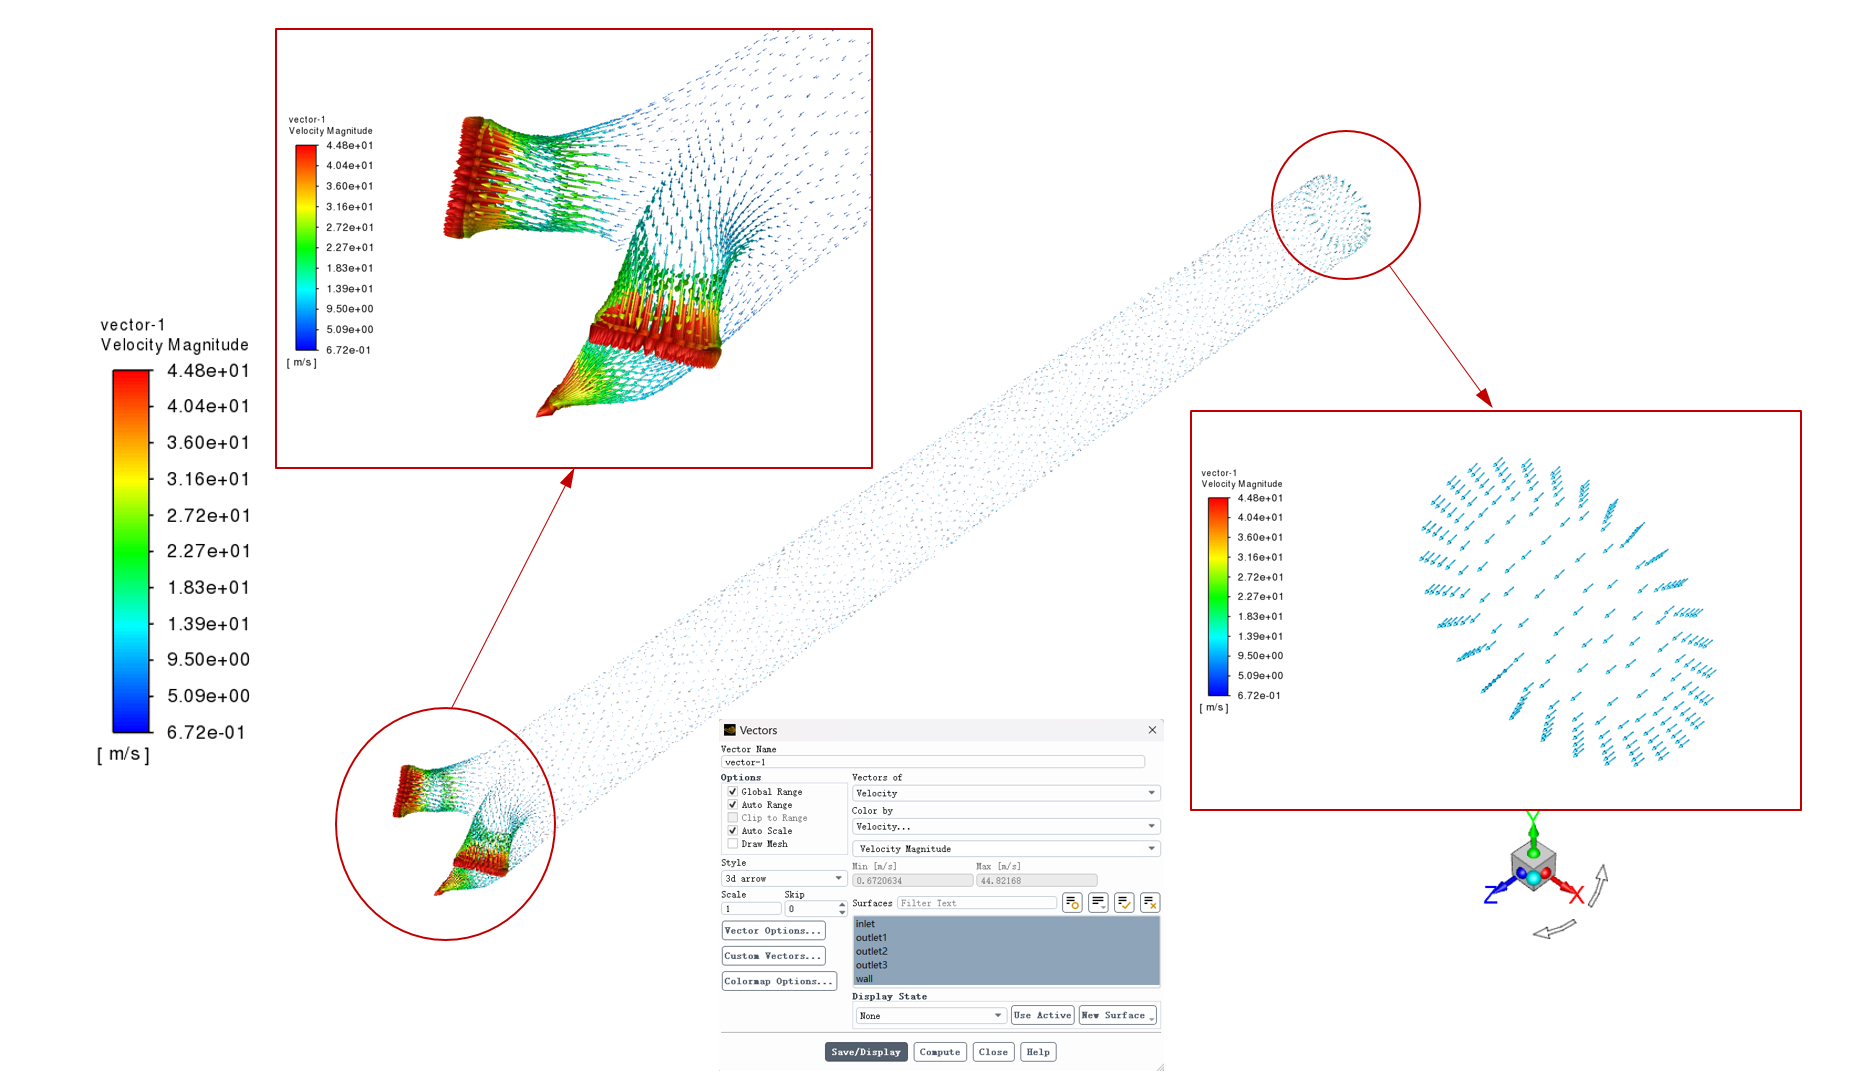
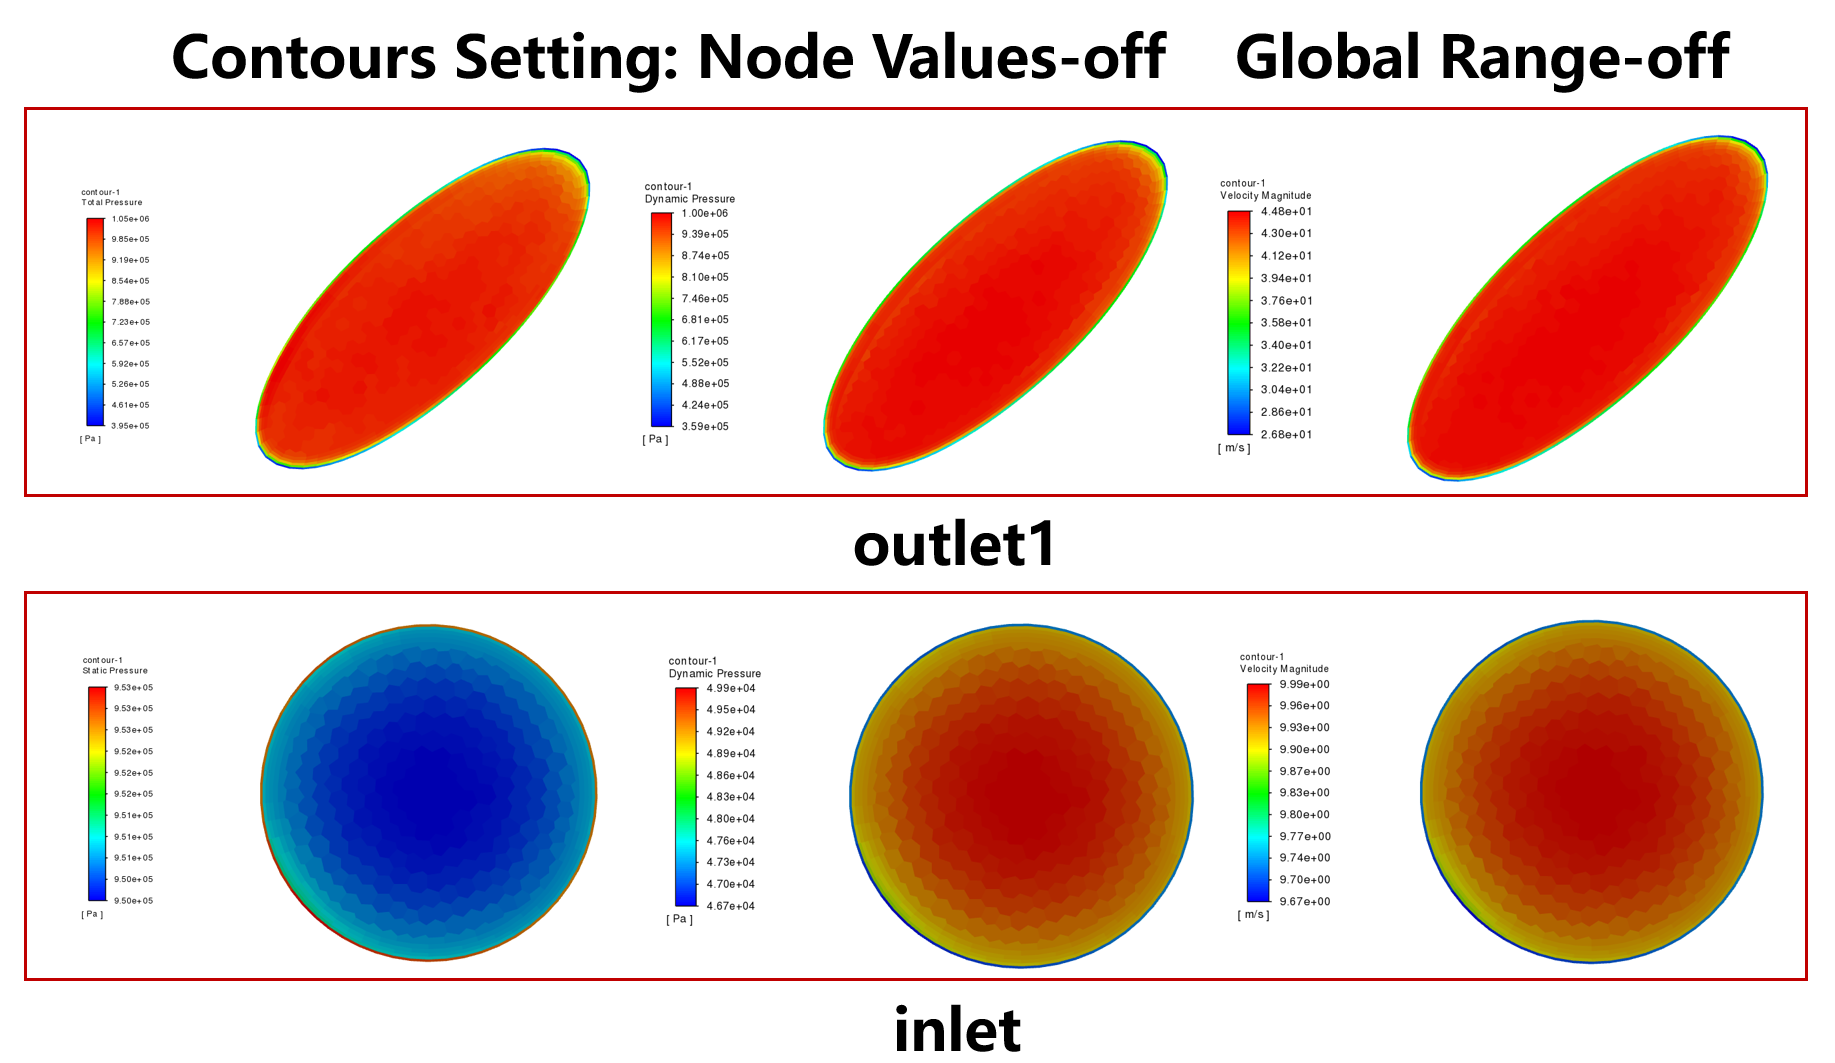
On each outlet surface plot contours with local scaling & node values off of each of static, dynamic & total pressure. Static should be zero, and assuming it is there's no need to post here; post the others. Do the same on the inlet. Also create similar images for velocity contours and vectors showing the local flow field.
-
July 25, 2024 at 2:07 pm
xukai214
SubscriberThanks. Can you first tell me how to turn off the local scaling? I am a beginner and only know how to turn off the node value.
-
-
July 25, 2024 at 2:14 pm
Rob
Forum ModeratorTo turn on local - you need to turn off global. Fluent will then scale the colourmap to the local (surface) range.
-
July 25, 2024 at 2:54 pm
-
July 30, 2024 at 1:30 am
xukai214
SubscriberDo you need any other results? I am looking forward to your reply.
-
-
July 30, 2024 at 8:50 am
Rob
Forum ModeratorApologies, the notifications are still alittle unreliable and I took Friday off.
Looking at the results I suspect part of the problem is the mesh. The jump in cell size from inflation to free stream is too aggressive. Look at the Total Pressure contours on the outlet to see the visual clue.
Plotting velocity vectors on walls tends not to be overly useful: think about what the velocity is on a wall. Post processing medical models is always difficult, but one trick is to look at "transform" in surface creation and/or use boundary registers to split the domain to get an interior at the edge of the inflation layer.
-
July 31, 2024 at 7:52 am
xukai214
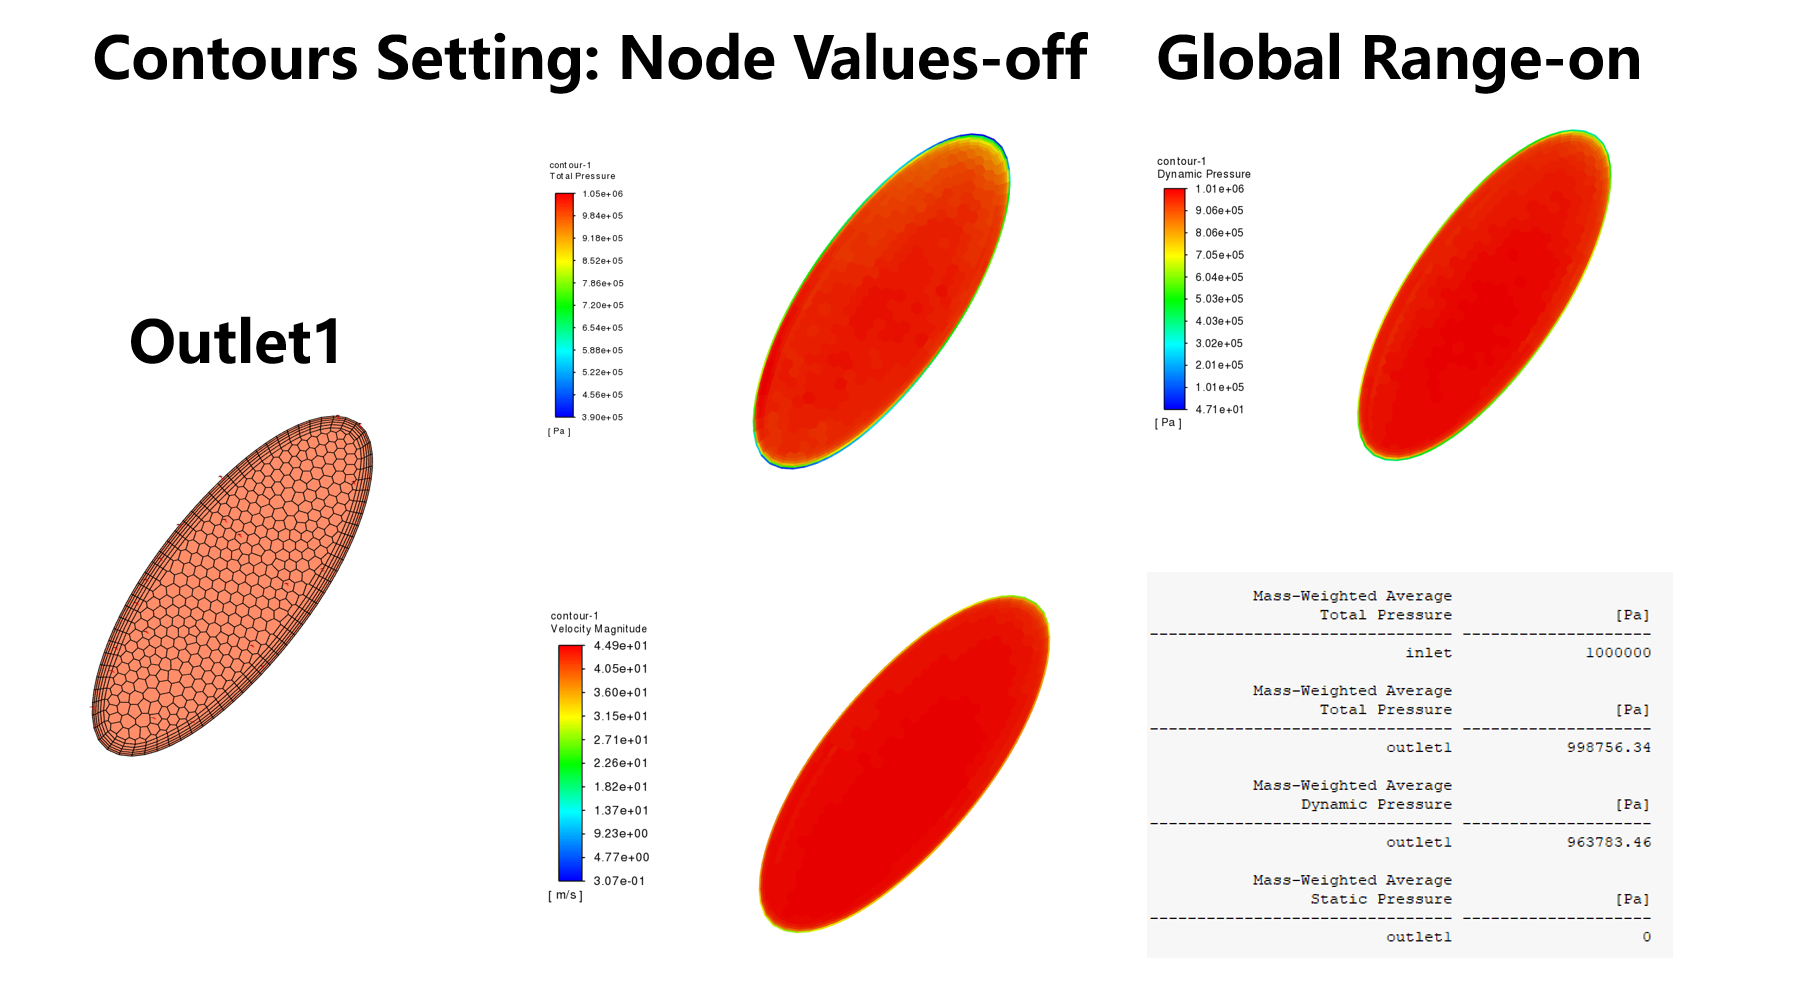
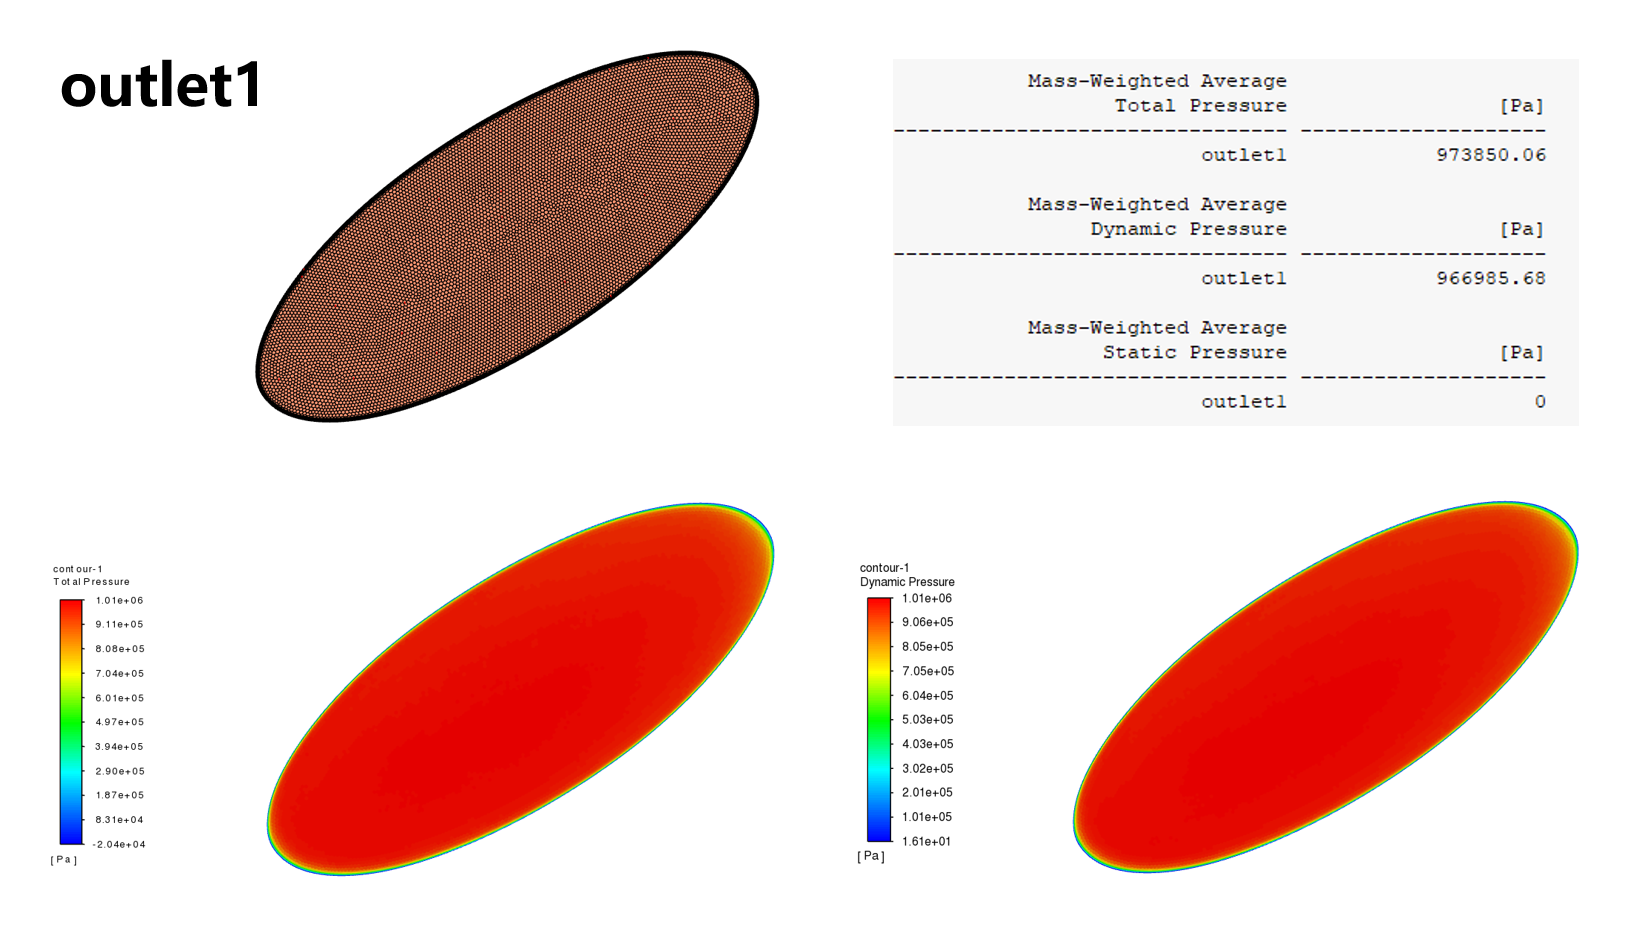
SubscriberFollowing your suggestions, we have refined the mesh at the outlets and the significant increase in cell size from inflation to free stream indeed has a big influence on the results. Now, total pressure of the outlet is lower than the inlet. This is very pleasing. The following images show the results of the calculation (Outlet2 and Outlet3 are same with Outlet1).
There is still a problem is that why total pressure is not equal to the sum of static pressure and dynamic pressure at the outlet? We have tried set the operating density as zero run on calculation after refined the mesh. There is no improvement in results.
-
-
July 31, 2024 at 9:00 am
Rob
Forum ModeratorLooking at the outlet contours my (educated) guess is it's still mesh related. Look at the ends of the outlets. You may need to reduce the curvature size function angle to increase resolution in that area. Ironically the more simple a geometry looks the more difficult it is to model well. You may also want to extend the outlets a few diameters if the profile is not well developed.
-
July 31, 2024 at 2:24 pm
-
-
July 31, 2024 at 2:32 pm
Rob
Forum ModeratorYou can review the mesh refinement (adaption) but otherwise it's a case of using local sizing to cluster mesh where it's needed. Meshing for CFD has elements of science, art and on occasion, magic.
-
August 1, 2024 at 12:48 am
xukai214
SubscriberThank you very much for your patience in solving my problems, you are the master of Fluent in my heart.
-
-
- The topic ‘Total pressure is not equal to the sum of static pressure and dynamic pressure.’ is closed to new replies.


-
4823
-
1587
-
1386
-
1242
-
1021

© 2026 Copyright ANSYS, Inc. All rights reserved.

