-
-
May 3, 2024 at 2:01 pm
S.S.S.ShankaVasuki
SubscriberHi everyone,
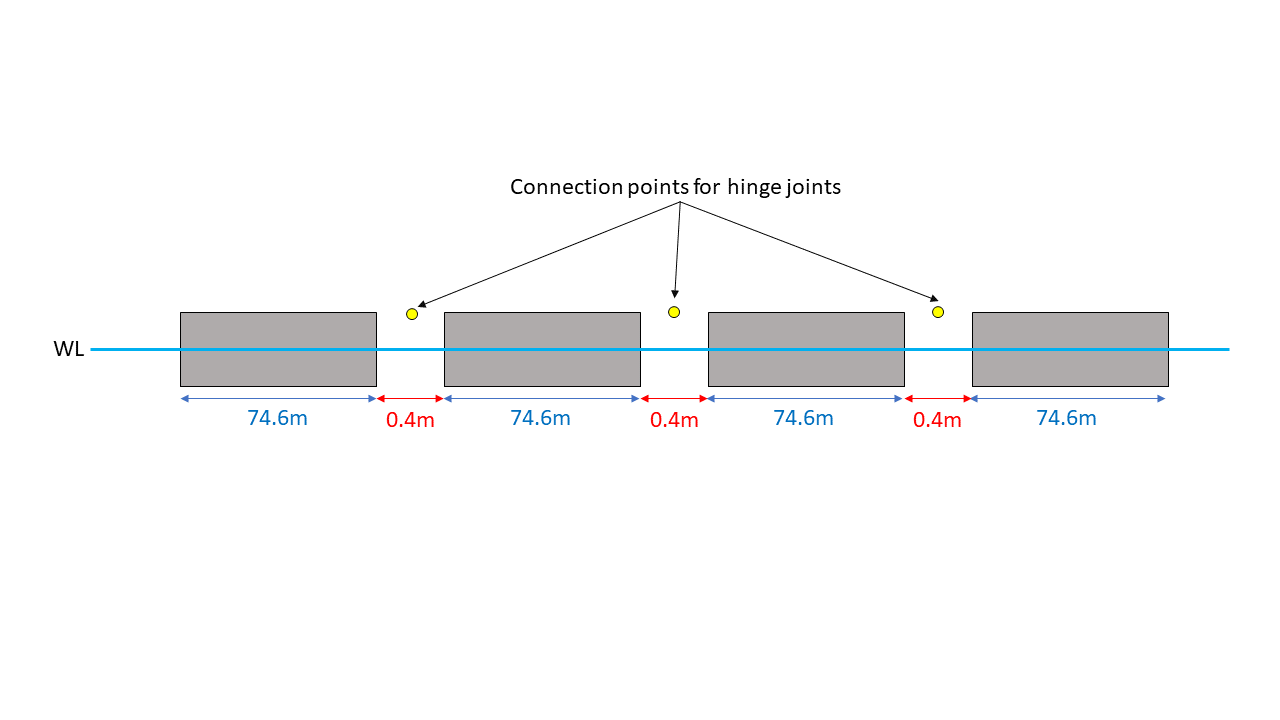
I'm currently working on simulating the response of 4 floating blocks connected to each other with hinged joints subjected to regular waves of amplitude1m, as illustrated in the attached image. My objective is to simulate the heave RAO [m/m] for all the 4 bodies at 0.7 rad/s using frequency domain analysis with hydrodynamic diffraction. Ultimately, I need 4 Heave RAO [m/m] values for the 4 blocks at 0.7rad/s
However, I'm encountering difficulties in doing the hydrodynamic diffraction simulation due to the connection stiffness matrix. I understand that the hinge connections are only considered in hydrodynamic response analysis and I need to specify the connection stiffness as a 6x6 matrix for hydrodynamic diffraction analysis.
For the hinged connection in the hydrodynamic response analysis, I would need to define the rotational stiffness about the y-axis which I obtained using a research article as 6.27e9 Nm/rad. However, this is just a single value and the connection stiffness is a 6x6 matrix.
Therefore Here are my questions:
- What does the connection stiffness signify? What do the notations (X,Y,Z,RX,RY,RZ) signify? I mean I know that they represent the translational and rotational motion of the connection but how do I read and the matrix as there is no sufficient information in the theory manual of aqwa?
How can I translate the single rotational stiffness (6.27e9 Nm/rad) to the connection stiffness as a 6x6 matrix to resemble a hinged joint?
Alternatively, if I opt to deduce the heave RAO using only hydrodynamic response analysis as I can fully define my hinged joint, how can I obtain the heave RAOs for each of the 4 connected bodies at 0.7 rad/sec? Currently, when I plot the heave RAO, the plot displays values in [m] instead of [m/m]. Additionally, in a time domain analysis, the heave RAO appears as a function of time, unlike the frequency domain analysis where I get a single RAO value for a particular frequency. So how do I get a single RAO value [m/m] for each block at 0.7rad/sec using HR analysis?
Any assistance or guidance on these matters would be greatly appreciated.
Thank you.
-
May 7, 2024 at 9:36 am
Shuangxing Du
Ansys EmployeeThe connection stiffness matricies are with respect to the COG motions of the connected structures. To manually create these matrices from the hinge connectors' properties and to assembly them into the required input is a hard work.
Alternatively, aftering running Hydrodynamic Diffraction, please try to run Hydrodynamic Response with the joint definitions -> Analysis Settings -> Computation Type as Freuqency Statistical Anlayis, with a definition of an irregular wave in the wave direction you want your RAOs to be calculated, the amplitudes of the RAOs can be displayed. The amplitudes and phases of the RAOs are listed in (your project)/FREQUENCY.LIS.
-
May 7, 2024 at 10:23 am
S.S.S.ShankaVasuki
SubscriberThank you for your response,
I did try to run the simulation as per your suggestion and I do have some questions.
- I am focusing on running the simulation for a Regular wave of amplitude 1m and frequency 0.7rad/s . But this analysis requires an irregular wave as an input. So I am wondering does this method give me the results I am looking for because the spectrum defines the results and the surface elevation would different for an irregular wave which would change the values of the RAOs?
- Also, I did use the JONSWAP spectrum as a trial case, and entered the starting and ending frequency manually as 0.71513 and 1rad/s, the significant wave height as 0.5m, gamma as 1 and the peak frequency as 0.8rad/s , and I did calculate the heave RAO for all the 4 bodies and these are the values,
Part 1 : 0.239 m/m
Part 2 : 0.12 m/m
Part 3 : 0.0162 m/m
Part 4 : 0.10151 m/m
But according to the paper I am trying to validate, the results are not what I am looking for. I have attached the validation plot to this thread for your reference.
3. Another weird thing I observed is that I get the same results when I have no stiffness mentioned for the hinge joint and when I specify a value of 6270000000 Nm/rad. I am not able to understand this as the results should change based on the stiffness I provide right? Maybe I am doing something wrong.
Please let me know where I could have gone wrong.
Thanks
-
May 7, 2024 at 2:45 pm
Shuangxing Du
Ansys Employee(1) if there is no nonlinear damping defined in your model, such as the drag on cables and/or hull, the RAOs will not be affected by the irregular waves, except the RAO integrating points (waves) in the wave frequency range from the starting frequency to the finishing frequency. In your case, you are interested in the results at 0.7 rad/s, please define the starting frequency to be smaller than 0.7 rad/s. The irregular waves are used to define the wave direction and further used to calculate the linearized drag damping in the frequency statistic response analysis.
(2) I guess that the results from the research paper were calculated/measured from a flexbible body, but yours is the multiple rigid bodies with flexbile connectors. Please make your joints to be located at the level of the vertical bending neutral axis of the structure and the hinge's local x direction is along the horizontal transverse directon of your structure.
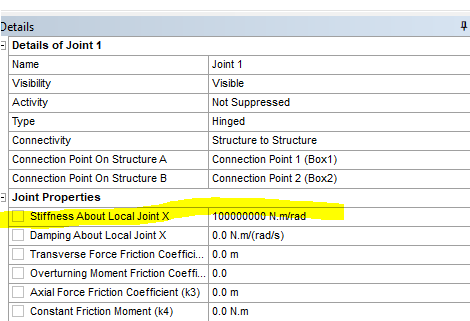
(3) the hinge joint stiffness should affect the RAOs. Please check (a) the stiffness about local joint X is defined and (b) the unit of the stiffness.

-
May 8, 2024 at 7:18 am
S.S.S.ShankaVasuki
SubscriberHello,
Thank you for the suggestions. Addressing your suggestions:
- Ah, I understood. This is now clear.
- Yes, you are right. I am trying to validate the response of a flexible structure by having multiple bodies connected together via flexible connectors. But the question is how do I determine the level of the vertical bending neutral axis of the structure and ensure the hinge's local x direction is along the horizontal transverse directon of your structure? Now the location of my connection points are as shown in the figure.
Are these coordinates correct for the connection points? Or Do I have to specify different coordinates? Could you please provide me a clear guide on how to select the coordinates for the connection points?
3. Yes, I have specified the joint properties as per your recommedation and I still get the same results. There is no change in the RAOs even if I change the stiffness values.
Please let me know on how to solve this issue. Thank you.
-
May 8, 2024 at 8:05 am
Shuangxing Du
Ansys EmployeeThe location of the hinge seem more reasonable. The link Bending Stresses - Ship Construction - Beyond Discovery may give you some clues on how it is about.
The hinges have no effect on the Hydrodynamic Diffraction analysis, but will affect the RAOs calculated by the Hydrodynamic Response with frequency statistical analysis.
-
May 8, 2024 at 9:55 am
S.S.S.ShankaVasuki
SubscriberThank you for your reply. I shall try running the simulation again. But I just had a last question.
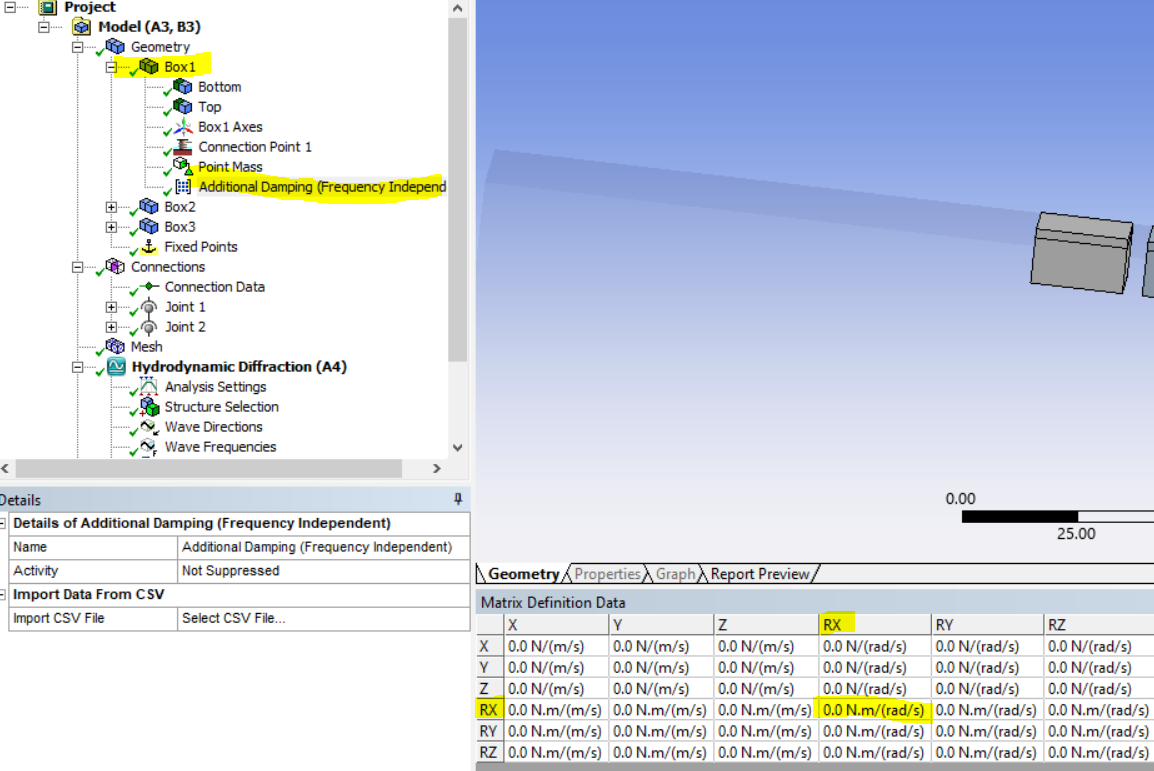
- In the research paper I am trying to validate, they mention – “for the motions of roll and pitch, the viscous damping coefficient of the bodies is set as 5% of critical damping”. So I just wanted to know what does this signifiy and where should I enter this value? and how do I calculate the value of critical damping?
Link to the paper: A method to Estimate Dynamic Responses of VLFS Based on Multi-Floating-Module Model Connected by Elastic Hinges | China Ocean Engineering (springer.com)
Please let me know.
Thank you!
-
May 8, 2024 at 2:28 pm
Shuangxing Du
Ansys EmployeeCritical damping is calculated by C/[2*sqrt(MK)]=C/[2K/omega_r]=C*omega_r/(2K). For roll motion, K is the hydrostatic stiffness of roll-roll, omega_r is the natural frequency of roll motion.
From this equation, the equivilant frequency-independent roll damping for each structure section could be 5%*(2K)/omega_r, where K is the hydrostatic stiffness of roll-roll of each structure section.
It is harder to find out the equivalent dampings of each structure sections for pitch motion, as the the viscous damping for pitch is for the whole structure.
-
May 8, 2024 at 4:02 pm
-
May 8, 2024 at 4:39 pm
-
May 9, 2024 at 9:37 am
S.S.S.ShankaVasuki
SubscriberThank you. I have incorporated all of your suggestions and now I have also increased the number of blocks from 4 to 16 to get better results and the results are shown in the plot below.
Based on this I have some questions:
- The red line refers to my simulation and the grey line refers to the research paper. Each dot on the red line represents the heave RAO of a single block at CoG. The response matches well until 250m which refers to the 14th block. But the response of the 15th and the 16th block (the last two blocks) are not matching well. The response of these two blocks reduces even further. I have tried all possible changes but no changes in the results. Could you suggest some causes for this difference and on how I can correct this?
- Also the values of the Heave RAOs have been taken from the hydrodynamic response - Time domain analysis with regular waves of amplitude 0.5m and frequency of 0.7rad/s. The question I have is - in the solution section of HR analysis, there is an option to plot RAO-Based Response for all 6DoF (my focus is just Heave RAO). Once I plot these for all the 16 bodies, I get the maximum and minimum values of each body as shown in the image below where each line refers to a block (I have taken only the maximum values in the plot shown above). So, I wanted to know whether these values are indeed RAOs as their units are in [m] or should I divide these values by the amplitude of the wave?

Please let me know what changes I can make to get better match with the paper.
-
May 9, 2024 at 1:04 pm
Shuangxing Du
Ansys EmployeePlease try to run Hydrodynamic Response with the analysis type of frequency domain statistic analysis, in which the RAOs can be calculated directly and displayed.
The time domain results may include the nonlinear terms.
-
May 9, 2024 at 1:57 pm
S.S.S.ShankaVasuki
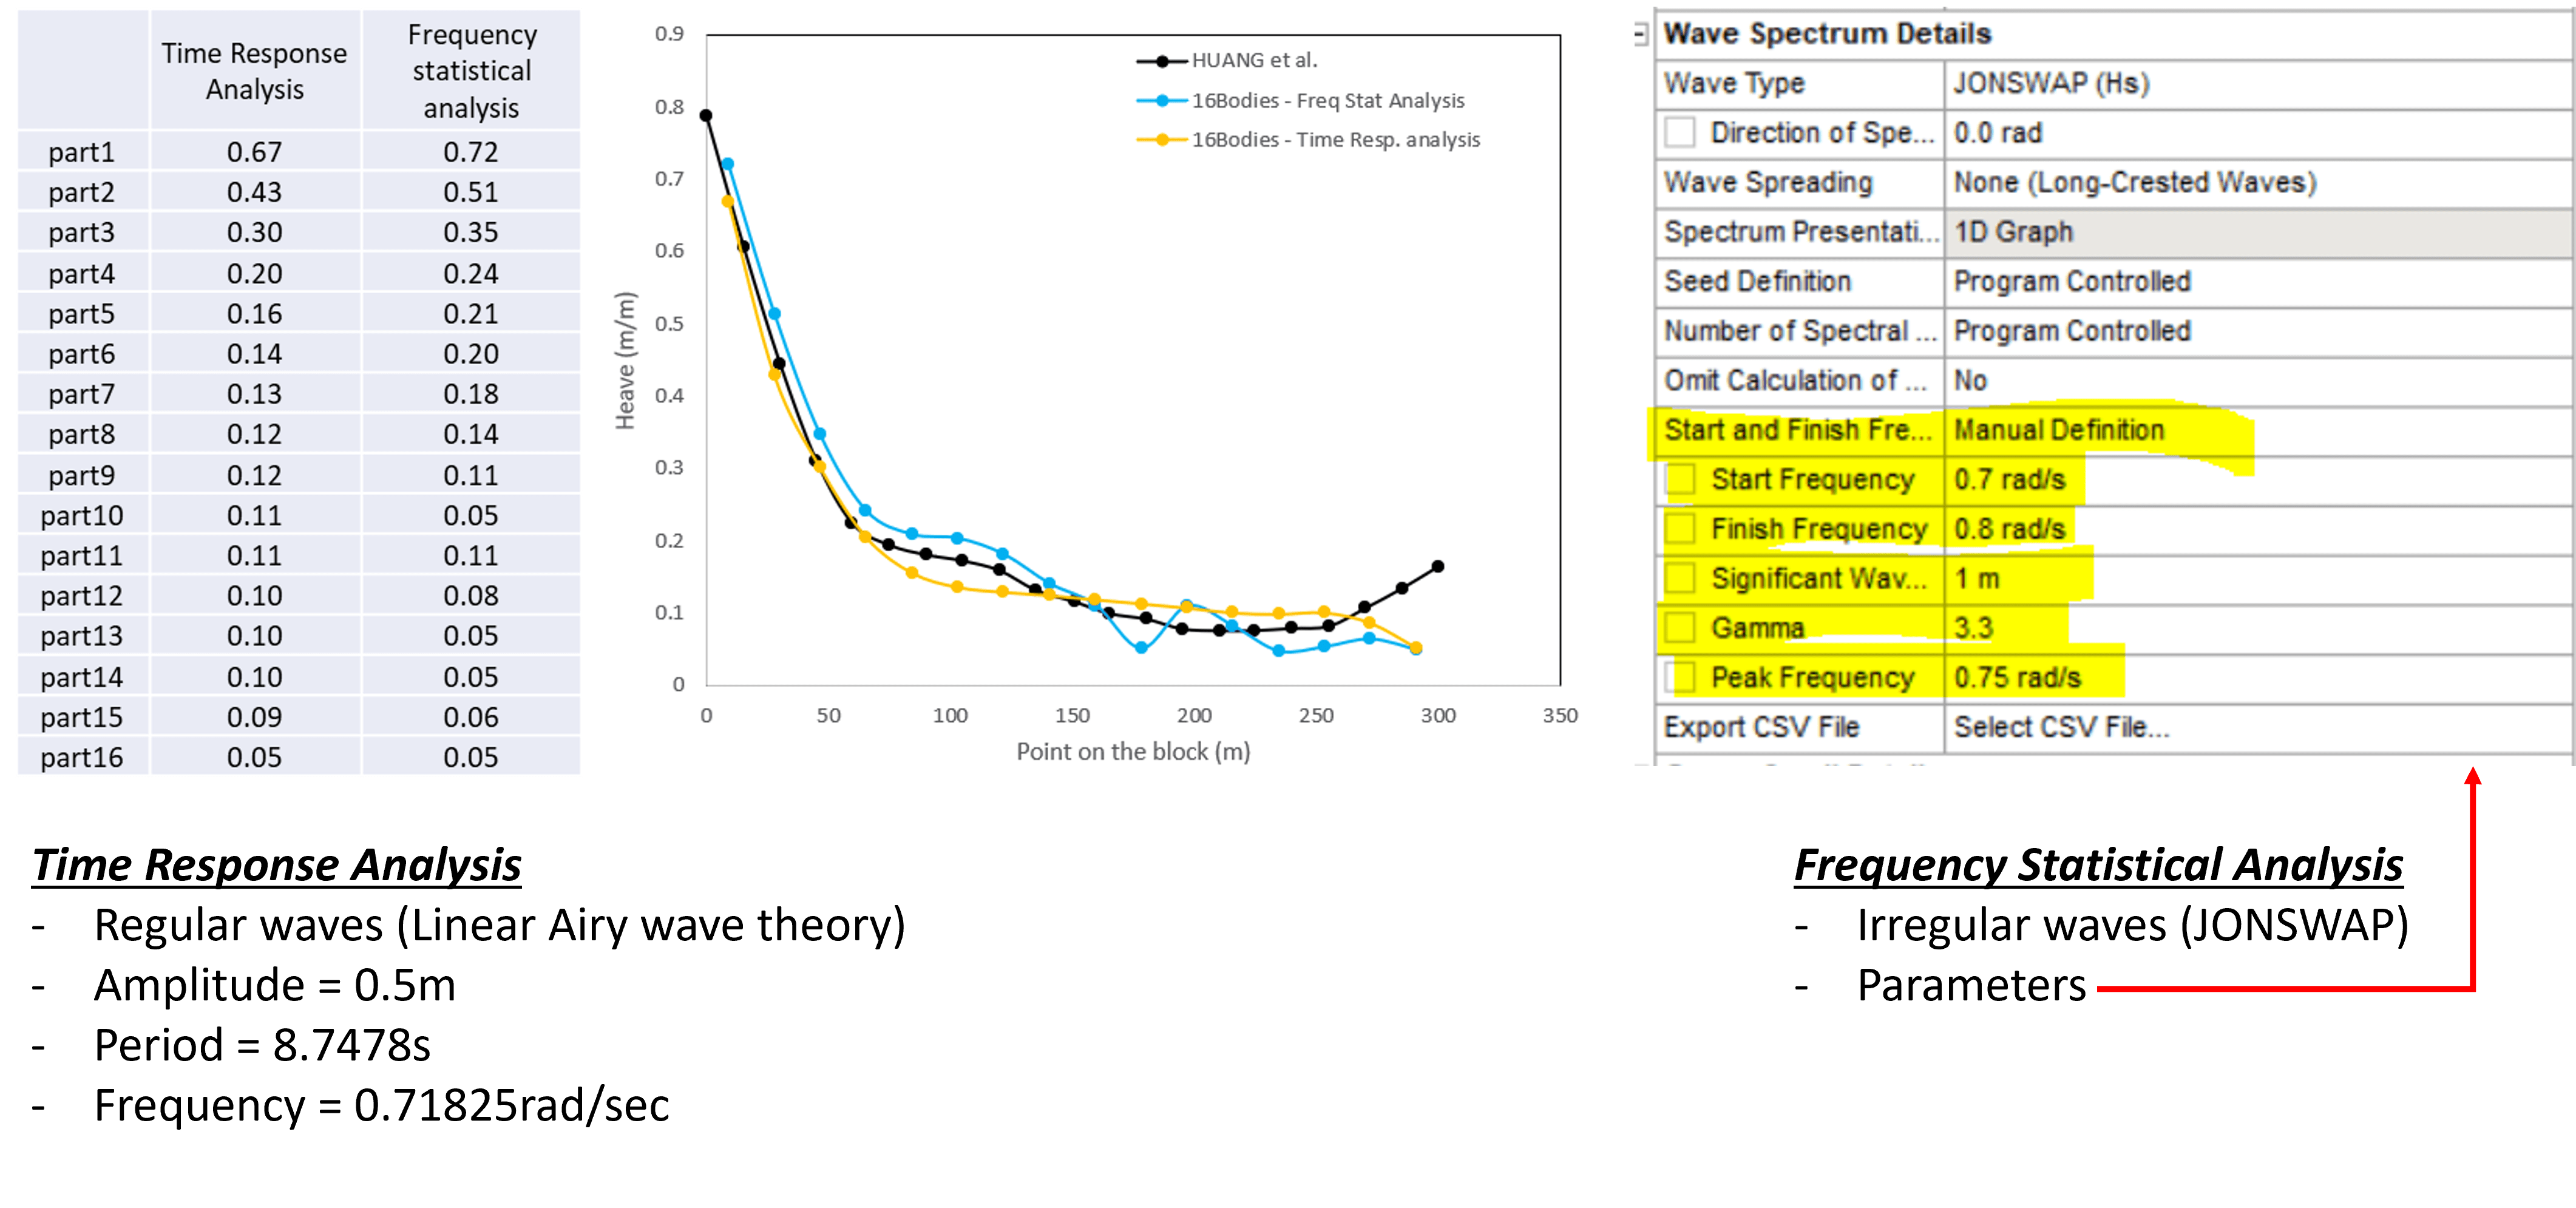
SubscriberHi, thank you for you reply. Yes, I have tried with the frequency domain statistic analysis as well and the results are as shown in the figure.
- I am not sure on the parameters I have specified for the irregular waves. Because although I need the RAOs at precisely 0.71825rad/sec, I am not able to extract the RAOs at this frequency value but instead the closest I get is 0.71975rad/sec. Can you please let me know what the values of the input parameters should be to define the irregular wave as per my requirement?
- Also I am not sure why the trend is different for part 10, 13,14,15. Is there anything I am missing? But the article I am trying to validate has used AQWA and have got a very close match with the experimental value. I am not able to figure out what I am missing in the simulation. It would be really helpful, if you can help me out with this.
-
May 10, 2024 at 8:05 am
Shuangxing Du
Ansys EmployeeThe spectral integration points are automatically defined, but will be refined near (1) natural frequencies of the structure system, (2) peak frequency of the spectrum. Based on these treatments, may I suggest to define the peak frequency at 7.1975 rad/s and the starting/finishing frequencies to be 0.5/1.0 rad/s? Please also check the water depth in your project, which should be the same as that in the reference paper. When you did the Hydrodynamic Diffraction analysis, did you set all the structures to be in a hydrodynamic interaction group?
-
May 10, 2024 at 10:54 am
S.S.S.ShankaVasuki
SubscriberThank you for your response. You mean 0.71975 rad/sec right? I did try with the input parameters as you mentioned, but I still get the same results. But I do somehow feel that the damping of certain bodies is leading to increase/decrease in the response. I am actually not sure on how to fix this issue. Would it be alright if I share my workbench file here?
Also, regarding your other questions:
- The water depth is set as 58.5m as per the reference paper.
- All the structures are in a hydrodynamic interaction group as shown in the figure below.
Please let me know on how to fix this issue. thank you for your help!
-
May 10, 2024 at 12:57 pm
Shuangxing Du
Ansys EmployeeI wonder if the joint stiffnesses near the bow are not realistic (too big)? As I mentione previously, I do not have the experience on how to distribute the known percentage of the critical pitch damping due to viscous effect of the whole ship on all the sections of the ship. Have you tried to do the calculation without these equivalent pitch damping? If the damping has less effect on the heave RAOs, it could be the problem from the joint stiffness.
-
May 10, 2024 at 1:02 pm
S.S.S.ShankaVasuki
SubscriberNo, the damping has a significant effect on the Heave RAO. Also the stiffness of the joints have been taken from the reference paper so I guess it should be correct as they have used the same values in aqwa have got good match with experimental data. I am not able to figure out what exactly I am missing. Would it help if I share my workbench file?
-
May 10, 2024 at 1:45 pm
Shuangxing Du
Ansys EmployeeI am sorry that I may not be allowed to have your project from Learning Forum. If you have the account for the Ansys technical support, please raise a ticket in the supoort system and attach your project.
-
May 11, 2024 at 5:57 pm
S.S.S.ShankaVasuki
SubscriberThank you. I did try running the simulation again, but I do get some similar results to reference paper but there are still variations in the response of the last few blocks. I also get some warnings and errors as shown in the image and I wonder this might be causing this discrepancy in the results. Could you please let me know on how to resolve this error. Thanks!
-
- The topic ‘Connection Stiffness Ansys AQWA’ is closed to new replies.


- air flow in and out of computer case
- Varying Bond model parameters to mimic soil particle cohesion/stiction
- Eroded Mass due to Erosion of Soil Particles by Fluids
- I am doing a corona simulation. But particles are not spreading.
- Issue to compile a UDF in ANSYS Fluent
- Guidance needed for Conjugate Heat Transfer Analysis for a 3s3p Li-ion Battery
- JACOBI Convergence Issue in ANSYS AQWA
- affinity not set
- Resuming SAG Mill Simulation with New Particle Batch in Rocky
- Continuing SAG Mill Simulation with New Particle Batch in Rocky

-
4512
-
1494
-
1386
-
1209
-
1021

© 2025 Copyright ANSYS, Inc. All rights reserved.


