Ansys Learning Forum › Forums › Discuss Simulation › Photonics › Bandstructure disagreement, FDTD vs MPB › Reply To: Bandstructure disagreement, FDTD vs MPB
I have tried increasing the simulation time up to 10 times the original 10 000 fs, but the result remains unchanged. I am limiting the frequency to visualize only the first five bands, but in Lumerical, many more bends appear in that frequency range.
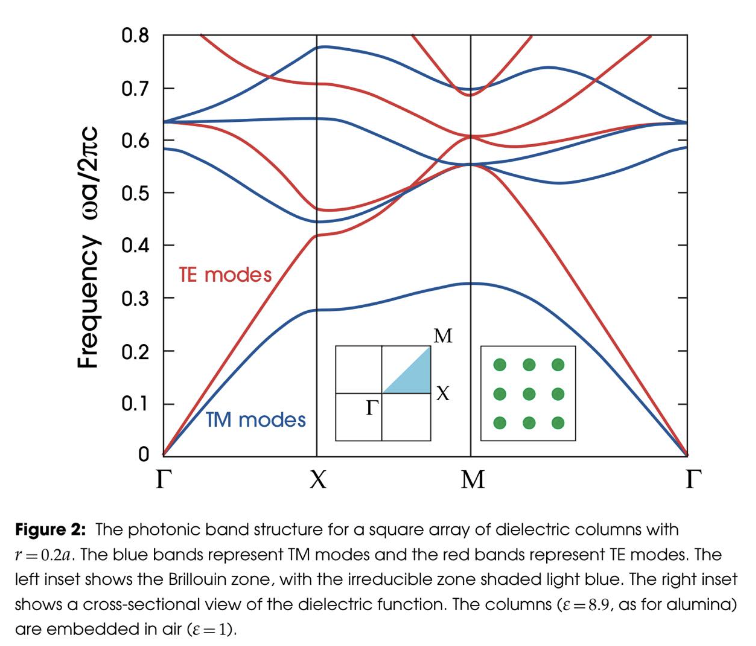
I have also confirmed that MPB is correct in this case by consulting the literature. For refference, there is a bandstructure of a PHC from [1] page 68
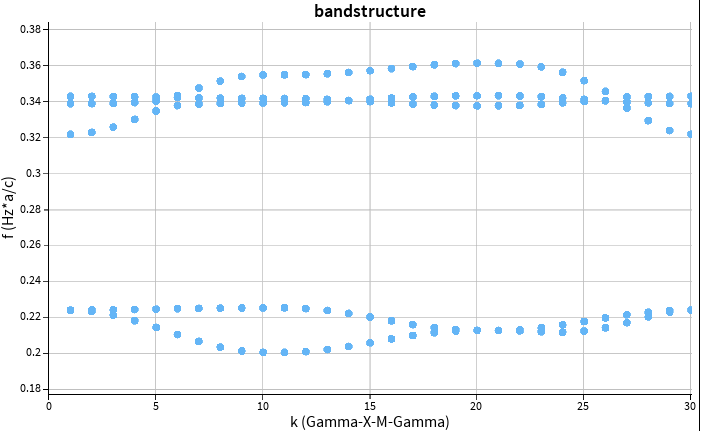
Using MPB, I am able to replicate the recults perfectly, but using Lumerical, I obtain this:
I have specifically targeted frequency range to go from 0.2 to 0.4 a/c.
I have used a=500 nm in my FDTD simulations.
Could you please help me reproduce the results from the [1] I have shown here? TM modes are sufficient.
[1] MEADE, Robert D. VE; JOHNSON, Steven G.; WINN, Joshua N. Photonic crystals: Molding the flow of light. 2008.


