-
-
April 2, 2024 at 10:52 pm
pnair
SubscriberHello,
I am working on the dipole simulations on SiCO thinfilm structure. I am using box of monitors to study the far field emission patterns. I am following the theory and simulation steps in this example"https://optics.ansys.com/hc/en-us/articles/360053540493-Micro-LED" for my simulations. I have used five monitors as my thin film is on a substrate.But, I am not able to generate the following plot by running the script mentioned in this example.
So, Could you please explain how to generate the above plot " current projection from 5 sides of the box."? I have generated all the other plots by running the script
- simulation file micro_LED_cylindrical.fsp
- script file plot_single_dipole_results.lsf to plot the figures.
Thank you.
-
April 2, 2024 at 11:50 pm
Amrita Pati
Ansys EmployeeHi Prabha,
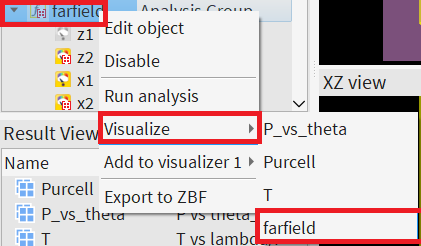
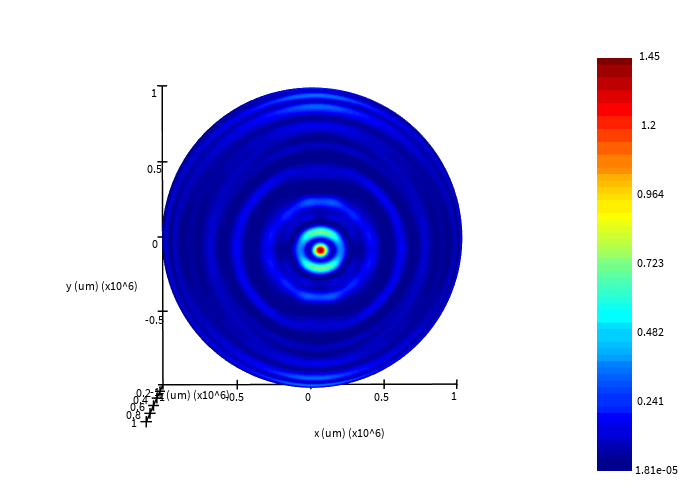
I found this figure in the appendix, so I don't see it mentioned that they are using a script to generate it. You can add a few lines of script to plot this from the "farfield" analysis group. Or you can just right-click on the farfield group-->Visualize-->farfield-->Ok (in the pop-up).
The plot is 3D, so you may rotate it to such that the x-y plane is normal to the screen:
Regards,
Amrita -
April 11, 2024 at 5:23 pm
pnair
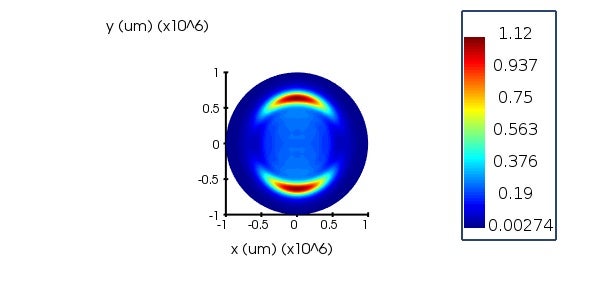
SubscriberThank you for the reply. I have generated this plot like you have mentioned here. But, I have a question related to the conversion of this plot to Angular polar plot. Is there any script to convert this plot to polar plot in terms of phi and theta? I mean how can i calculate far field plots from box of monitors using only 5 monitors?
Please find the attached plot that I have generated from the above plot. And I have a question related to the X& Y axis of this plot? Do they represent the Ux and Uy direction vectors?
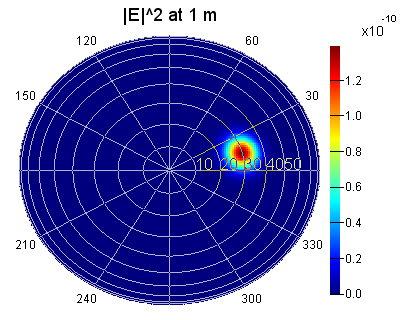
Following is the example of a farfield polar plot which I would like to generate from this:
Thankyou.
-
- The topic ‘Regarding box of monitors’ is closed to new replies.


-
4633
-
1535
-
1386
-
1225
-
1021

© 2025 Copyright ANSYS, Inc. All rights reserved.


