-
-
March 15, 2024 at 7:08 pm
gcharalampous
SubscriberGreetings,
I am currently engaged in research involving the Electro-optic Effect, focusing on calculating the static electric field across my waveguide in LUMERICAL Charge. The waveguide's cross-section aligns with the XZ axis, resulting in a 2D y-normal E-field monitor type. My objective is to optimize the configuration and placement of metal electrodes while determining the appropriate oxide thickness based on the varying magnitude of the E-field across different points within the waveguide.
I aim to extract the E-field vector data (Etotal, Ex, and Ez) and plot them in Python, resembling a quiver plot, to comprehend the direction and magnitude of the E-fields. However, the E-fields comprise a 1D array, while my E-field monitor is a 2D array. Are the E-fields sliced? If so, in which direction across the X or Z axis are they sliced?
Thank you for any assistance or insights you may provide.
Warm regards,
GC -
March 15, 2024 at 9:43 pm
Guilin Sun
Ansys EmployeeThe data is not sliced. instead, it is from the finite element meshing that makes it 1D. You will need to interpolate it into 2D graph:
it has example script file for reference.
-
March 16, 2024 at 1:47 am
gcharalampous
SubscriberThank you, Guillin, for the fast reply. That was the function I was missing. I do have one last question.
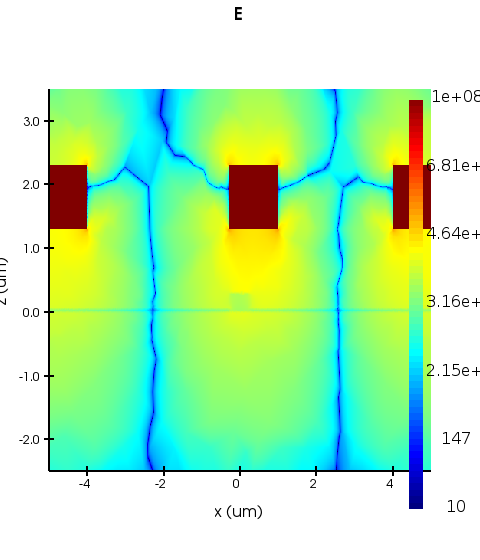
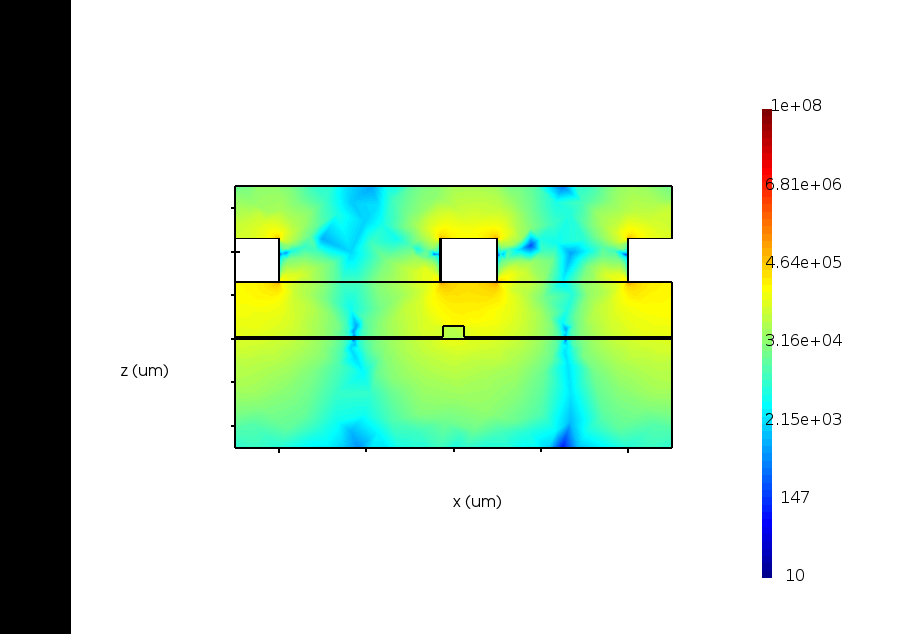
I believe I have successfully interpolated the E-field from the 1-D triangular grid to the rectilinear 2-D grid. This is the interpolated E-field:And this is the E-field I can visualize from the Lumerical 2D data visualizer:
I believe the two plots look quite similar. I understand they differ in terms of grid size, number of points, scale, etc. However, the main difference I notice is that in the interpolated plot, the E-field appears infinite inside the metal conductors. In the Lumerical plot from the visualizer, the E-field is zero in the metal conductor. The E-field should be zero inside the conductor according to Ohm’s law. Is it a numerical error coming from the
interptriscript command function? -
March 18, 2024 at 5:17 pm
Guilin Sun
Ansys EmployeeI agree with you. AS you know, zero E fields inside metal is theory, whereas the interpolation is pure math. It just uses the results from neighbour elements to get some values, regardless the physics.
Therefore I believe it is numerical error.
-
- The topic ‘Optimizing EO Effect: Analyzing Static E-Field Distribution’ is closed to new replies.


-
3817
-
1388
-
1188
-
1100
-
1015

© 2025 Copyright ANSYS, Inc. All rights reserved.


