-
-
March 9, 2024 at 1:51 pm
Vahram Voskerchyan
SubscriberI have High Q cavity and want to find the Q factor using High Q resonance calculations. I have time monitors placed like this:

This position is difened by the maximum of the confined field and placed accordingly on the peaks to achieve strong signal.
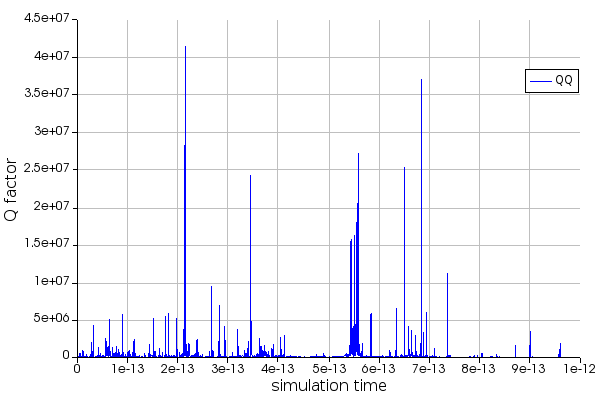
Now when I try to calculate Q factor at different times I get the follow (here I have sampled the finished time and just swept accross the signal)Why Q factor varios so much versus the time?
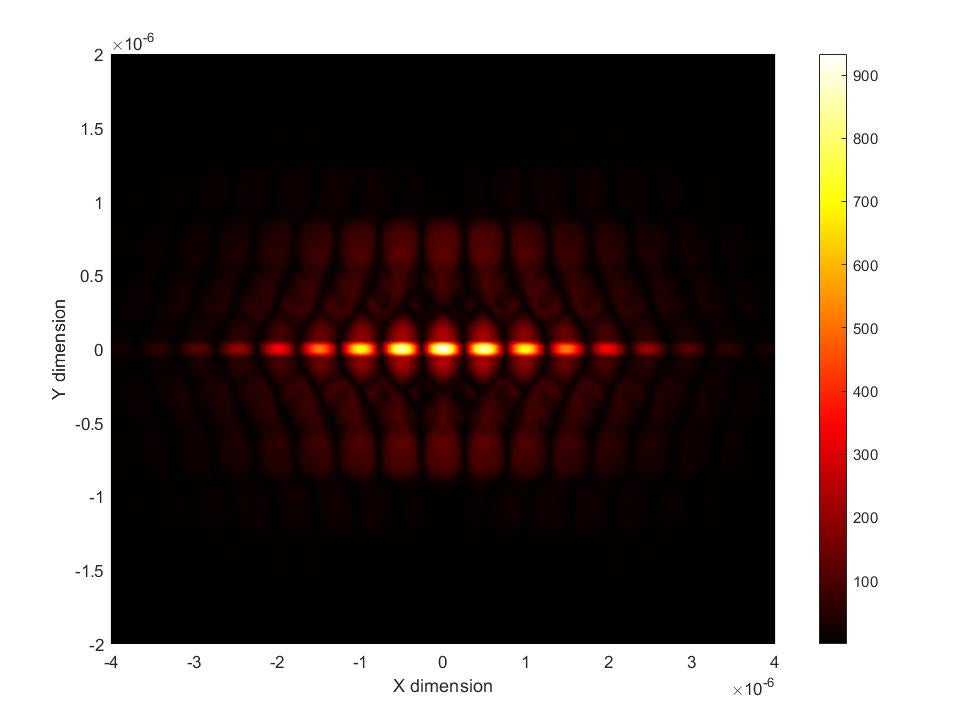
My resonance field looks like this and monitors are placed on the peaks of this field.

-
March 11, 2024 at 6:10 pm
Guilin Sun
Ansys EmployeeMay I know how do you get the Q factor vs time?
When Q factor is over a million, simulation time might need to be long, and choose only the highest Qs and use log scale to plot the intensity vs time and see if it is straight line. Please refer to this link https://optics.ansys.com/hc/en-us/articles/360041611774-Quality-factor-calculations-for-a-resonant-cavity and check the 2D example.
You may use its analysis group (high Q) for your simulation file, and place it near where it gives the highest Q.
I personally do not use too many time monitors, since the signals are summed up, and the low Q monitor signal may affect the high Q signal. You can use more such analysis group, and each uses a few time monitors. You can easily move the groups to where you consider the signal is strong for the highest Qs.
This might need a few iterations to get the final result.
-
March 12, 2024 at 11:44 am
Vahram Voskerchyan
SubscriberHi Guilin,
Thanks for your reply. I just swept over the signal and calculated the Q factor at each time and plotted the graph. I think here the best think is to isolate the peaks using the example here:
https://optics.ansys.com/hc/en-us/articles/360041611774-Quality-factor-calculations-for-a-resonant-cavity
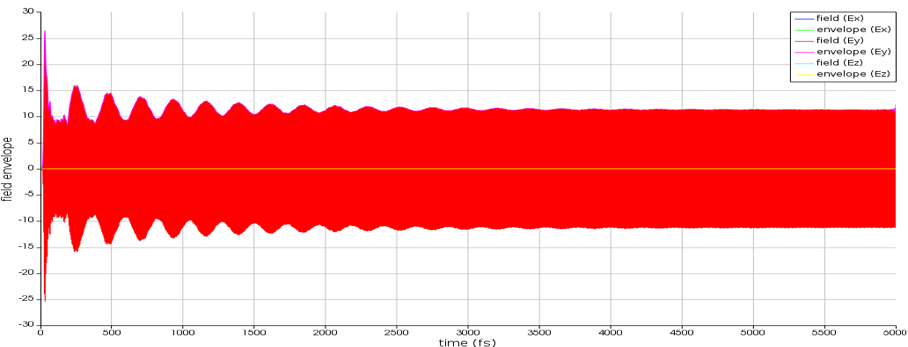
But I was just curious why at certain times the Q factor is so high and the other times no and I could trust the value. Using the Gaussian filters to isolate the peaks gives me the Q of ~10e4 which is something I would expect. The signal looks really strong and the simulation time is high so that the signal becomes flat, shown below:
Thank you,
Vahram -
March 12, 2024 at 3:14 pm
Guilin Sun
Ansys EmployeeI am not sure what is the relation between Q and time. Since the signal is bounced back and forth, and using resonancefind is to get the Q from the signal analytically, it might be time dependent. For the signal like what you gave above, I would prefer to use fft method at the later 1/3 section.
Actually the signal is not flat. instead, it is sinusoidal. Please zoom in and check, which should be the resonate frequency oscillating.
-
April 3, 2024 at 3:37 am
Muhammad Danial Haziq Azizan
SubscriberAccording to theoretical principles, the Q-factor should be calculated based on the Full Width at Half Maximum (FWHM) of the resonance obtained. Failure to adhere to this principle may necessitate validation of the result. This involves confirming whether the values derived from both the formula and simulation align. Similar challenges arise when using Lumerical, particularly in 2D Photonic Crystal (PhC) structures with line defects and cavities positioned at the center of the waveguide.
-
April 3, 2024 at 4:51 pm
Guilin Sun
Ansys Employee"According to theoretical principles, the Q-factor should be calculated based on the Full Width at Half Maximum (FWHM) of the resonance obtained"
This is only one theory, and it is simplified if you know.
Harvard used Lumerical FDDT to obtain Q over a million in 2008:
Murray W McCutcheon and Marko Loncar. 2008. “Design of a silicon nitride photonic crystal nanocavity with a Quality factor of one million for coupling to a diamond nanocrystal.” Optics expressOptics Express, 16, Pp. 19136-19145.Please be assured that the method calculating Q from the analysis is theoretically correct. The only thing you need to take care is to make sure the time slot you choose is proper.If you use the log method, make sure the intensity at log scale vs time is a straight line. If you use findresonance, it does not need long simulation neither.
-
- The topic ‘How to select the simulation time to accurately calculate the Q factor.’ is closed to new replies.


-
4673
-
1565
-
1386
-
1236
-
1021

© 2025 Copyright ANSYS, Inc. All rights reserved.


