-
-
January 11, 2024 at 6:13 pm
w.u.maddumage
SubscriberI am currently working on a steady-state heat transfer simulation using Fluent, focusing on a two-phase system involving oil and air. The setup includes a heated copper solid plate with oil injection for cooling, where approximately 20% of the metal is in contact with the oil jet stream, and the remaining part is exposed to surrounding air.
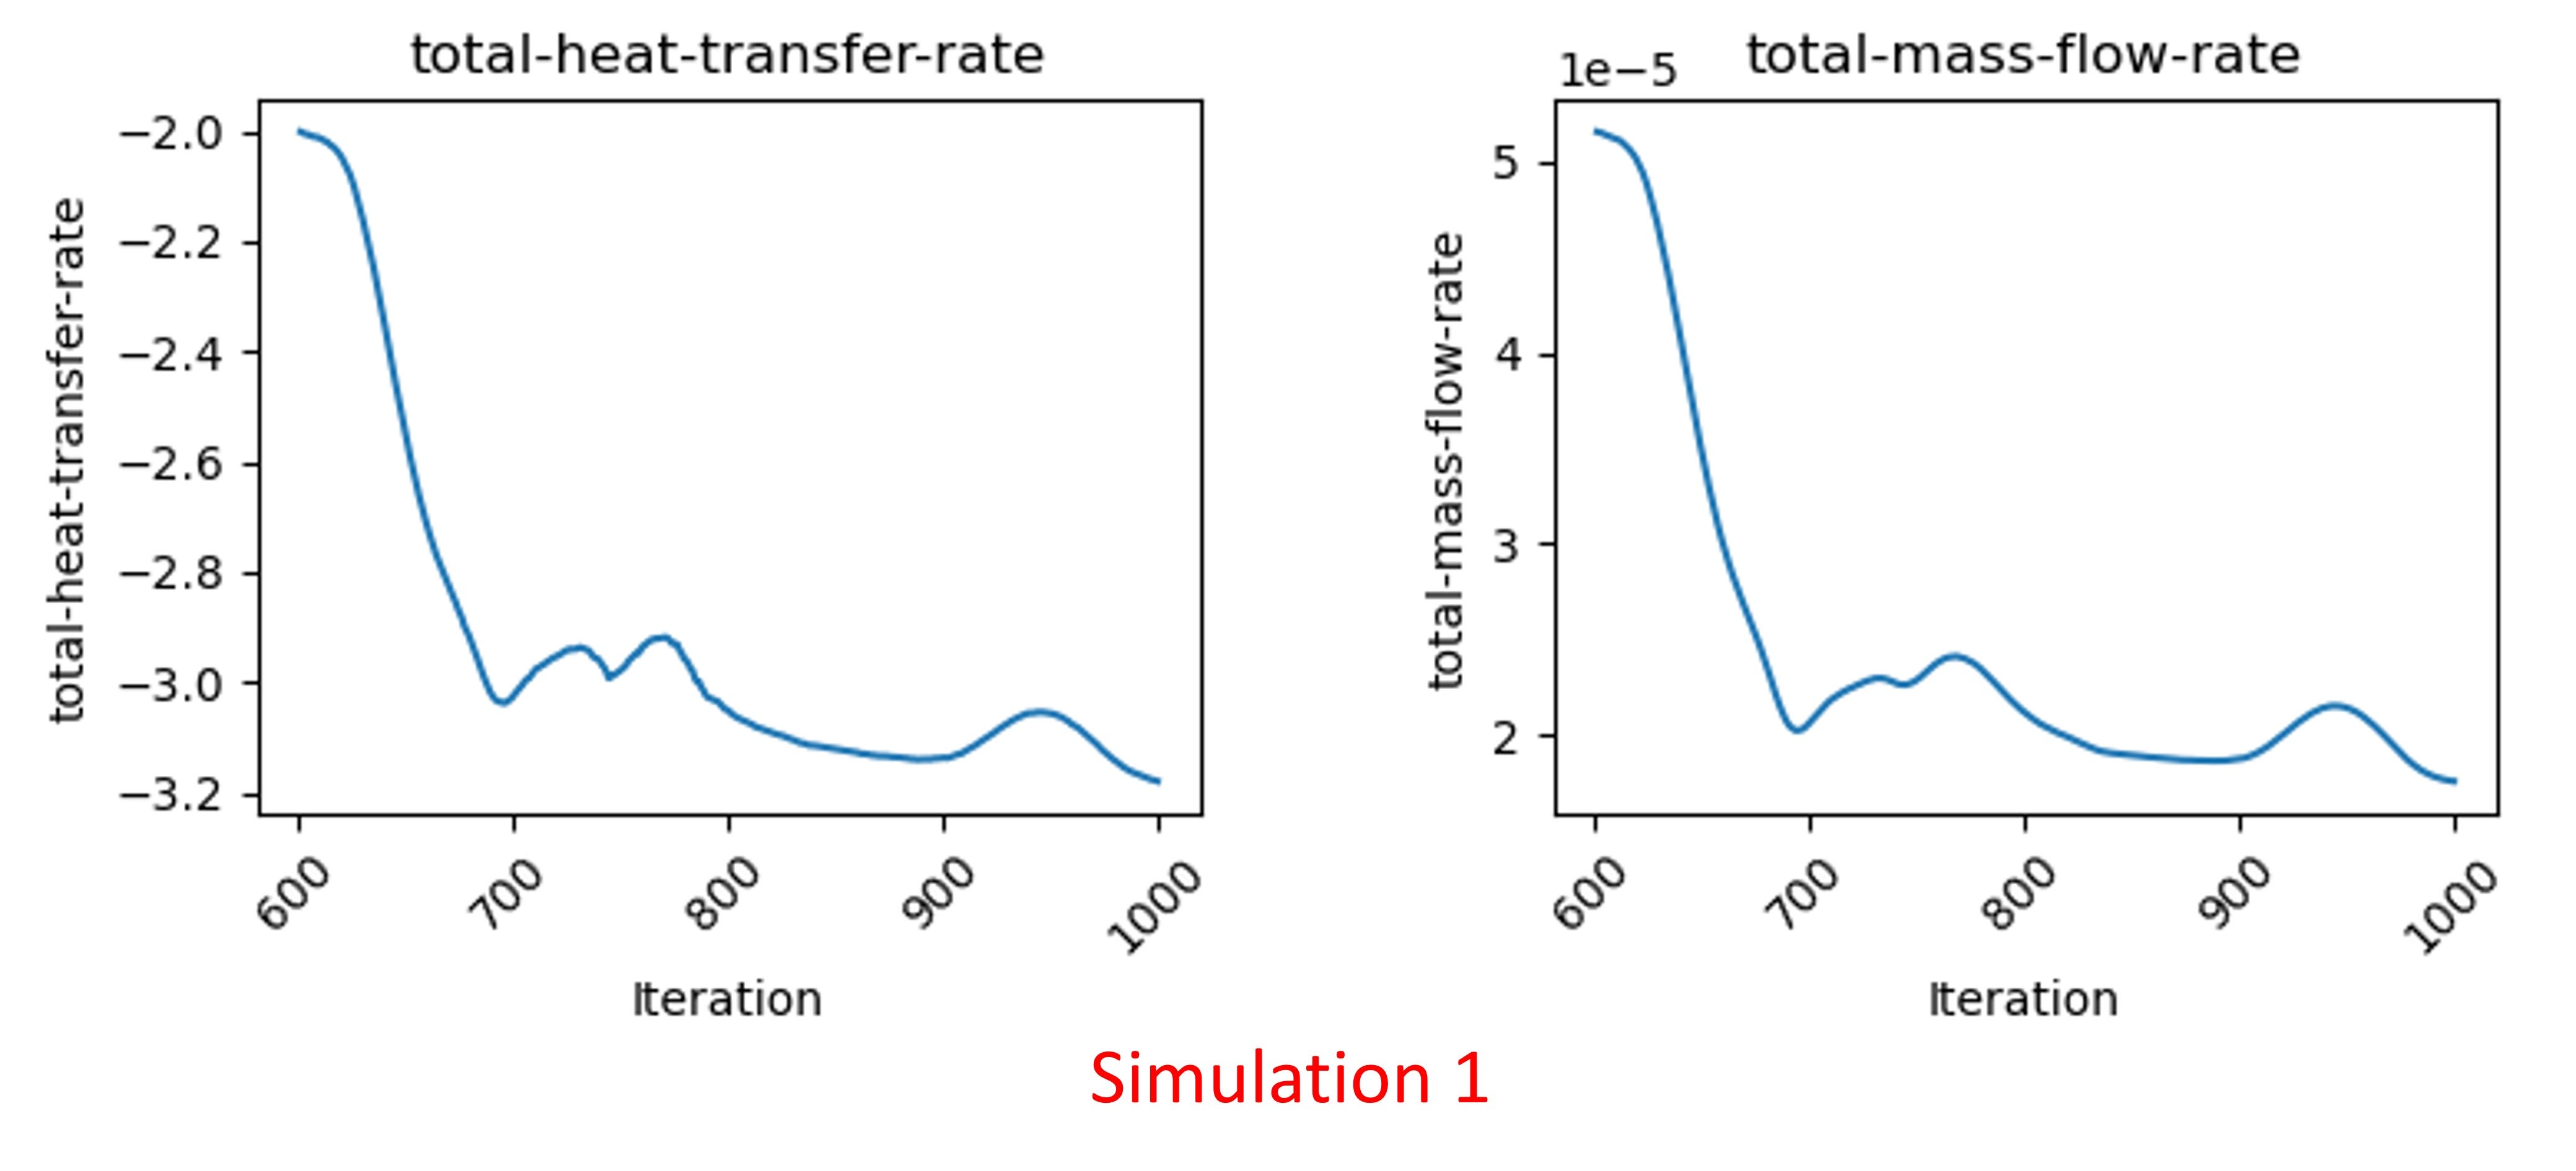
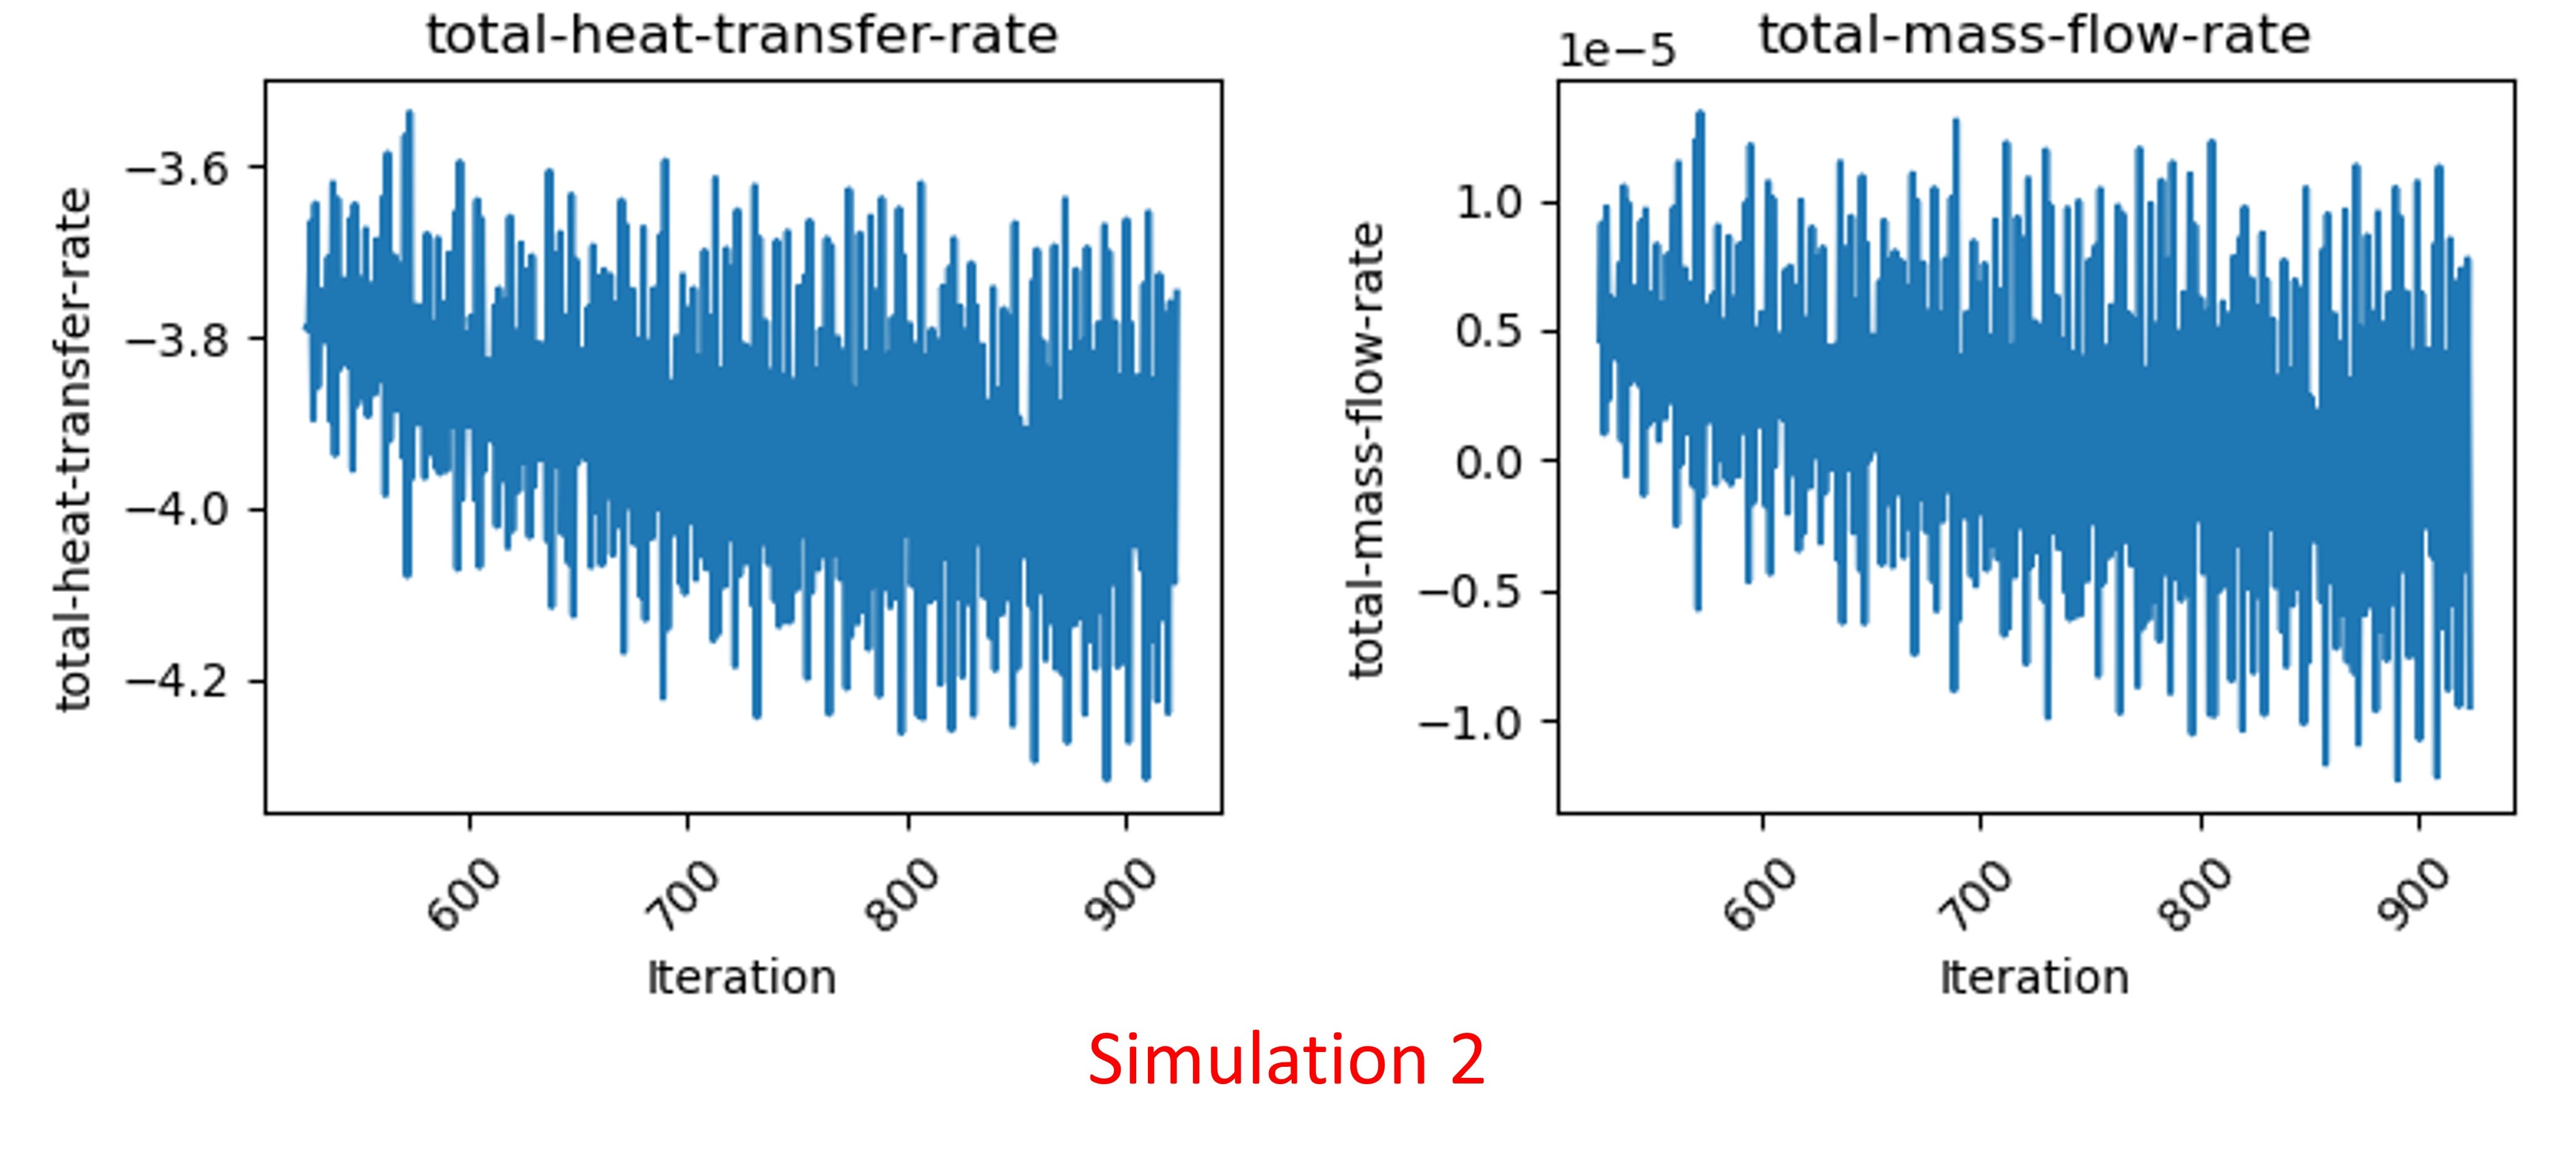
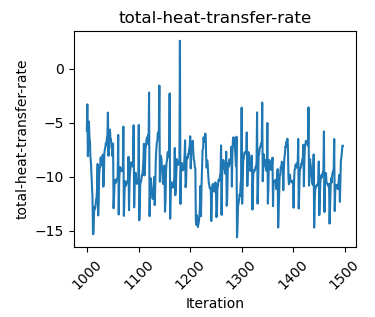
I ran two simulations of this case with a slight change to the oil-injecting nozzle position. As shown below Simulation 1 gave me a very stable total heat transfer rate and total mass flow rate while the other gave extremely unstable results.
Mesh properties are as follows,
- Simulation 1: Orthogonal quality (2.36), aspect ratio (237), 10 boundary layers at the thermal boundary layer, Max y+ value around 1.5, average y+ below 1.
- Simulation 2: Orthogonal quality (2.14), aspect ratio (145), 10 boundary layers at the thermal boundary layer, Max y+ value around 1.5, average y+ below 1.
Here are some key details of my simulation (these are common to both):
- Computational domain with one velocity input (only oil injection, no air) and one pressure output (oil and air escape, backflow of air is seen during simulation. But backflow of oil is not allowed).
- Adiabatic walls and coupled solid-fluid contact surfaces.
- Metal geometry defined as a constant heat source.
- Multiphase model using VOF with Implicit formulation.
- Turbulent model: K-omega SST.
- Steady-state simulation with pseudo-time stepping and enabled high-order term relaxation.
I would greatly appreciate any insights, suggestions, or recommendations to improve the stability of the total heat transfer rate and mass flow rate in the second simulation.
Thank you in advance.
Waruna
-
January 12, 2024 at 1:03 pm
Rob
Forum ModeratorIf you plot contours every 10 iterations or so of VOF and velocity what do you see? Relying purely on monitor data means you may be missing something else that's happening in the model.
-
January 16, 2024 at 3:38 pm
w.u.maddumage
SubscriberHi Rob,
Thanks for the quick reply. I plotted a few contours on velocity and vof in xy,yz, and zx planes. Between iterations, they look identical. Do you have any other recommendations? What else can I check to see the reason for the instability?
Also, if we take an average of the unstable plot, the results are very close to what we want. Is this something done in practice? Can I plot a moving average plot of the total heat transfer rate and mass flow rate and see how the system behaves?
Many thanks,
Waruna
-
January 16, 2024 at 4:46 pm
Rob
Forum ModeratorYou can use the averaging on steady and transient calculations and this is fairly routine where we're trying to damp a fast transient or "false" transient. However, you also need to investigate the underlying cause: using numerical techniques to "hide" effects can lead to incorrect interpretation of the results.
Did you plot every 1-2 iterations or at 10-20? Noise can be convergence based or the solver oscillating between several valid solutions: the differences can be very small and hard to spot.
-
January 16, 2024 at 5:54 pm
w.u.maddumage
SubscriberHi Rob,
This time, I plotted contours for 50 iterations. At each iteration, I saved six plots: three plots (i.e. xy, yz, zx planes) of Velocity magnitude and VOF. When I go through the saved images I can see small changes in the boundary of the VOF and Velocity magnitude. Especially the VOF plot shows repeated oscillation of some sections of the boundary.
However, this kind of behaviour in the VOF boundary is expected. We are looking at a liquid stream hitting a complex geometry. A turbulent splash shows this kind of behaviour.
As you mentioned, could this be noise? or solver oscillating between valid solutions. How can I differentiate between the two?
Thanks,
Waruna
-
-
January 17, 2024 at 9:13 am
Rob
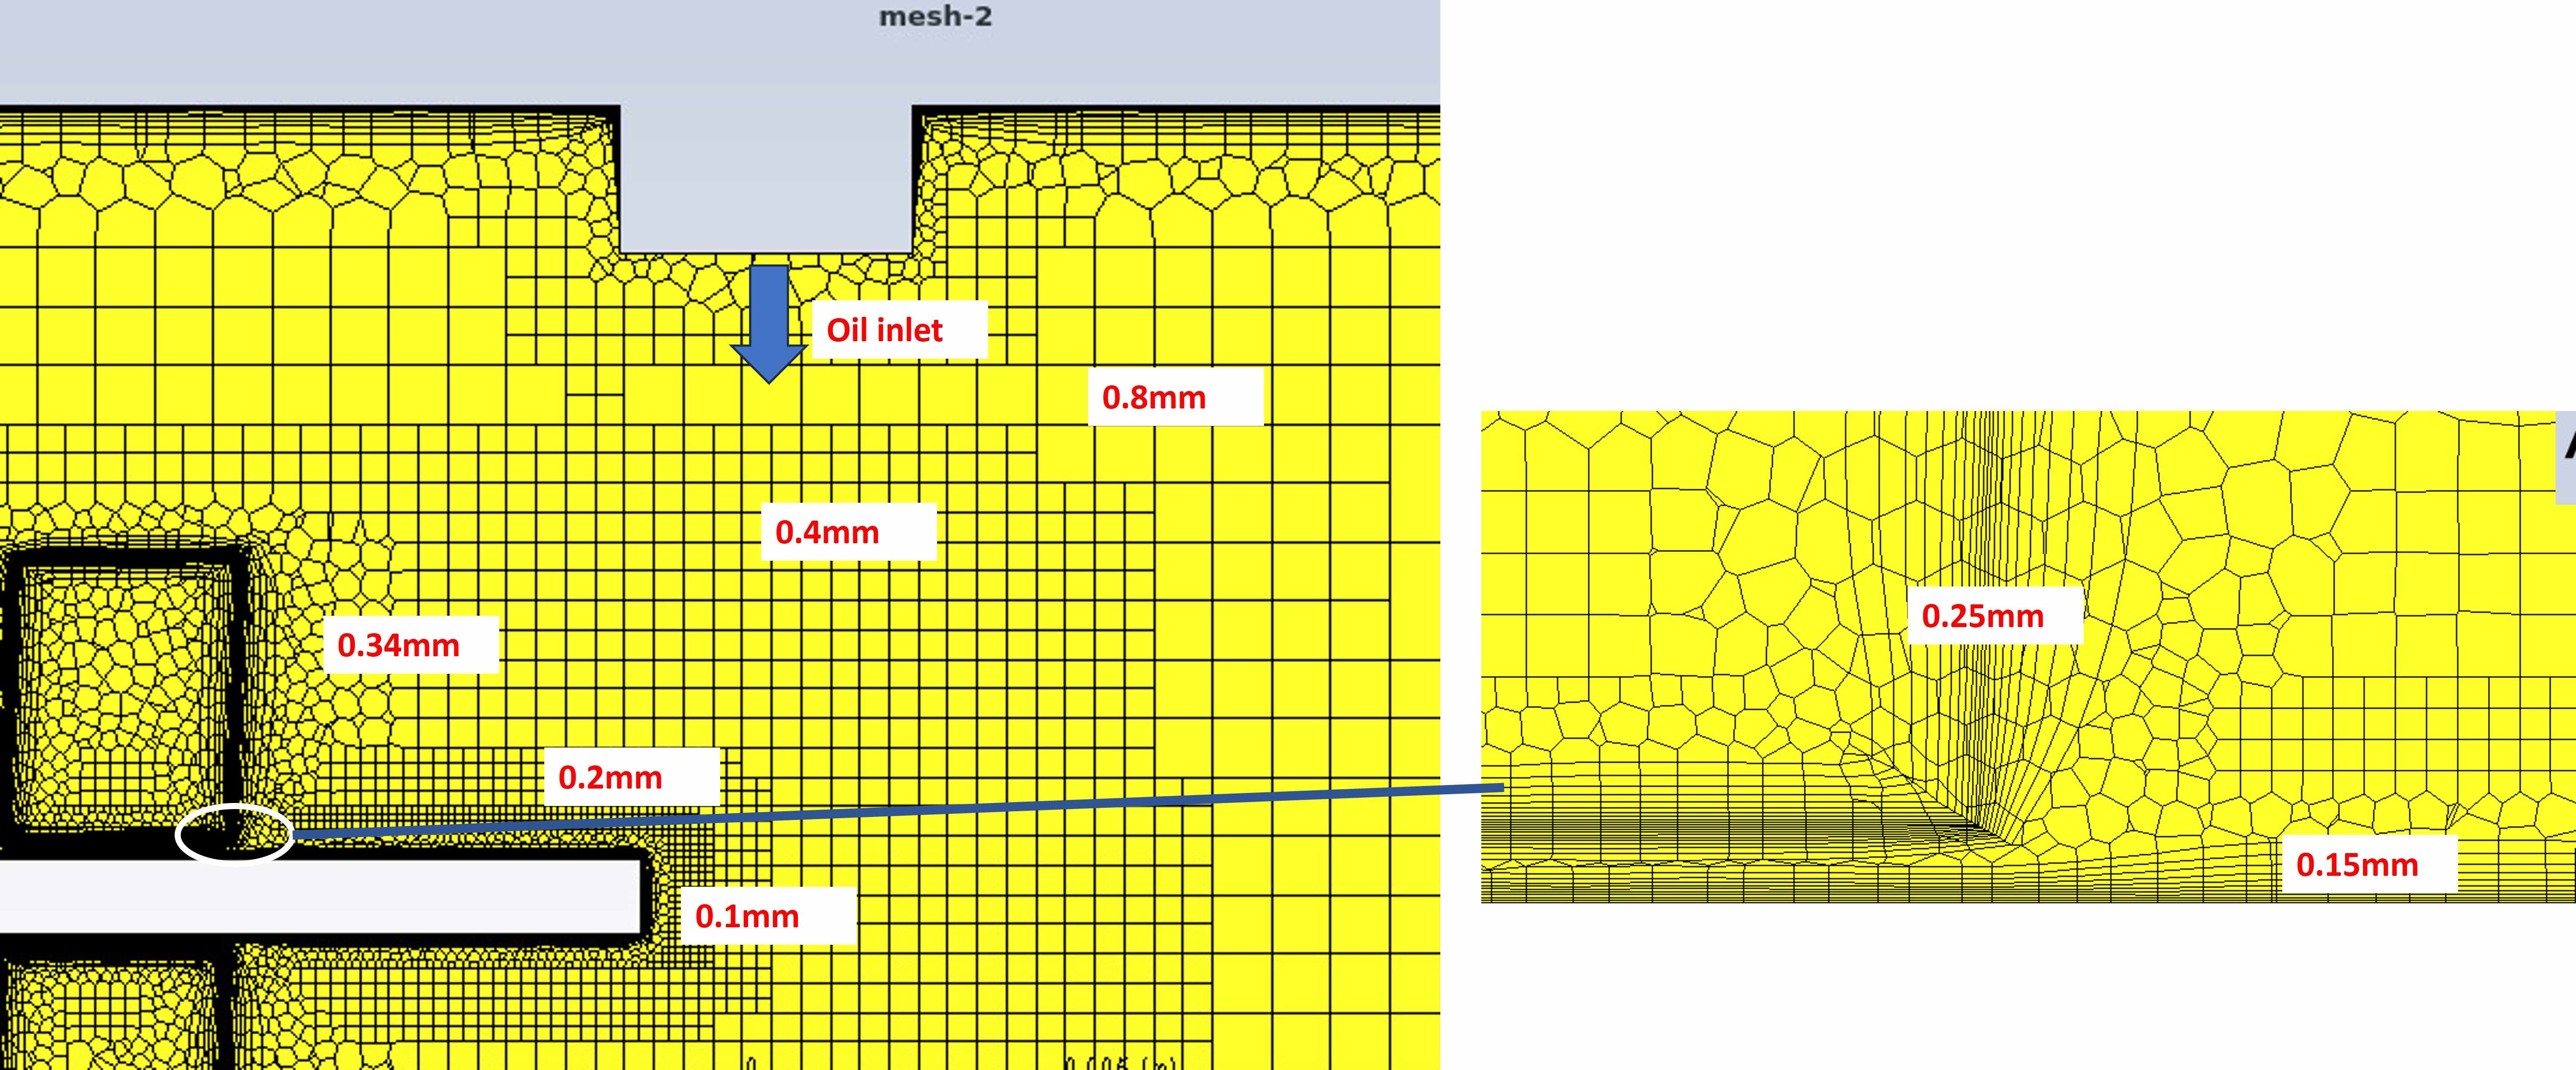
Forum ModeratorI would expect VOF to move with time, but you've not mentioned that you're running transient. You've also not mentioned cell size - how well resolved is the jet impingement and film region?
-
January 17, 2024 at 10:12 am
w.u.maddumage
Subscriber
-
-
January 17, 2024 at 11:11 am
Rob
Forum ModeratorOK, with steady you may be picking up transients in the flow, these can lead to instabilites and/or poor convergence.
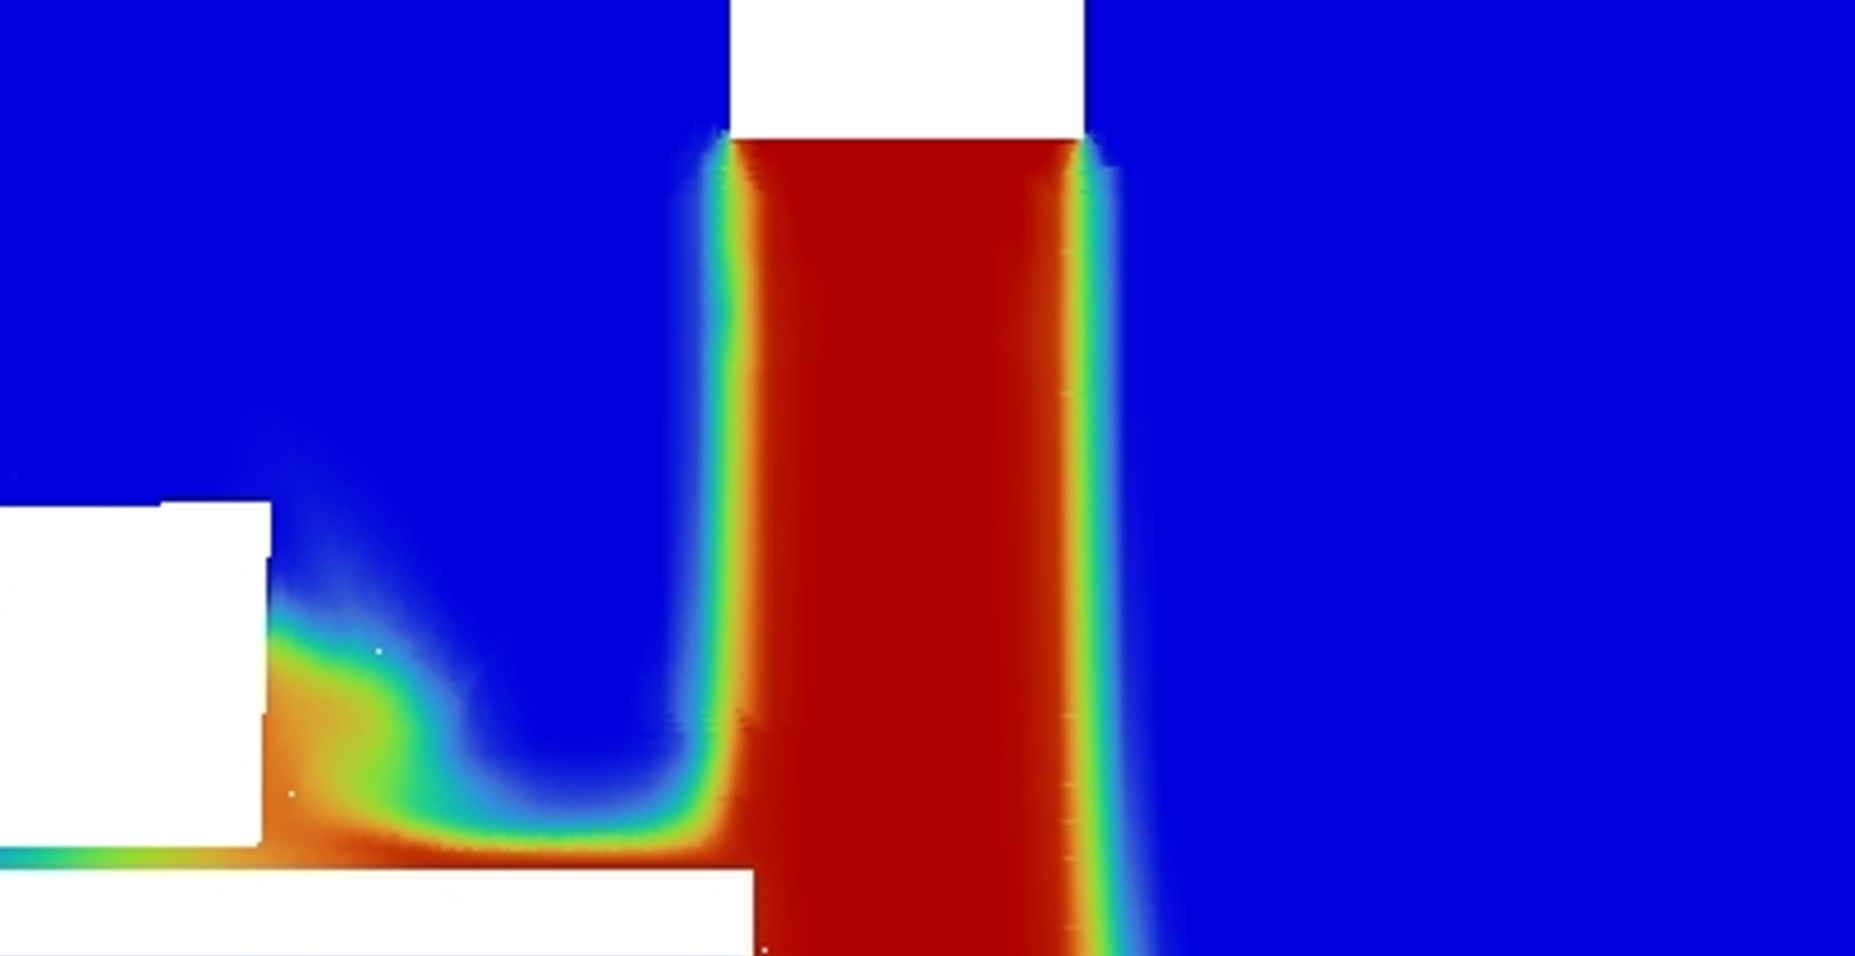
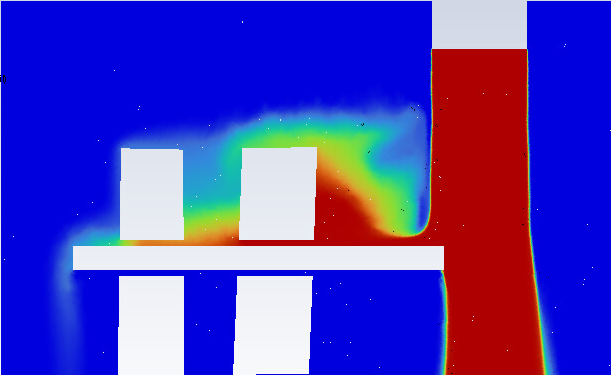
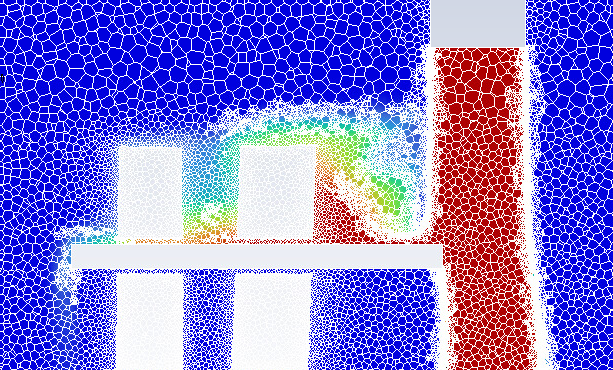
Regarding the mesh. High aspect ratio (inflation layers) and VOF tend not to work well together as the flow changes along the cell. Ideally you need to resolve both the boundary layer and along the wall: that makes meshing more computationally expensive as it increases the cell count. You can also see the cell size change in the VOF contour - more resolution around the jet may be needed. Similarly in the splash region. I tend to avoid hexcore to have better control over the cell growth rate: poly may be a better choice.
As a general rule liquids increase heat loss by a factor of around 25 (it's why staying dry when it's cold out is good - general knowledge, look it up!) so slight changes in VOF position could easily give the results you're seeing. If you run transient how does the result look?
-
January 17, 2024 at 9:28 pm
w.u.maddumage
SubscriberHi Rob,
I'll check the poly mesh. In the meantime, could you clarify a few things? Considering our HPC capacity, I don't think we can go over cases with more than 15M cells (now we are around 10M). What kind of a maximum aspect ratio are you suggesting, currently it's 145.
As for the transient simulations, for converging results mesh maximum aspect ratio needs to be below 30. Otherwise, the residuals start to diverge. However, this kind of mesh is nearly impossible to run in our system within a reasonable timeframe. This was one of the main reasons why we settled on the steady state.
Also, despite all these problems, results are within 9% of experimental results. Considering our computational capacity, I don't think we will be able to get the perfect mesh here. We are planning to do a parametric study based on the validated case. Can we be confident that the results of the parametric study will be within 9% if we proceed with the current mesh? or is the VOF behaviour very unpredictable in high aspect ratio meshes that results will not be reliable at all?
-
January 18, 2024 at 9:14 am
Rob
Forum ModeratorI generally aim for an aspect ratio as near 1 as possible if the free surface is interacting with that surface. That's probably excessively fine, but I think 5 is mentioned somewhere.
Maybe look at symmetry or otherwise review what's in the model. 10M cells is large in some respects (my PhD models took over a month with 95k cells - big model for the time) but is also fairly small in others. Also look at how much resolution is needed away from the jet. If nothing much happens how much resolution is needed?
Finally, are you using the results to prove a point (ie concept design) or to find a single numerical value (prototype or safety critical check)? Can you defend removing the noise from the output monitor? A part of the planning process is figuring out what do I need, as opposed to what do I want: and whether I can afford (time & cpu) to do it.
-
January 18, 2024 at 9:48 am
w.u.maddumage
SubscriberThank you Rob for your explanation. This is part of my PhD and it is a concept design. We are trying to see how heat transfer would change when we vary system parameters like nozzle diameter, flow rate, temperature, etc. We are not looking at a single value for a prototype design or critical safety point.
Our need is to compare the performance with different system parameters. I think the first step would be to identify exactly how much error is expected in our results. If it is acceptable, we can do the parametric study and narrow down these system parameters. Once we have an understanding of how the system behaves and a narrower system parameter set, I am planning to go for an experimental study to find exact values. Please let me know if you have any thoughts or concerns with this approach.
Also, going back to my last question, is the VOF behaviour very unpredictable in high aspect ratio meshes (around 100) that results will not be reliable, I'm trying to understand the error we can expect in results.
-
January 18, 2024 at 12:02 pm
Rob
Forum ModeratorOK, so you're after trends and not necessarily precise values.
Inflation is used to capture the flow boundary layer (thermal too, but let's keep it simple) whilst not having to resolve too much in the streamwise direction. This works well when there is no change along the cell: ie it's good for attached flows over wings etc. It's not good if the flow changes along the cell, so flow detachment, impinging jets and nearly every interesting multiphase simulation.
So, we also need to resolve along the wall. That costs you cell count. Or, you don't resolve the boundary layer to the same detail: y+ is an overused guide and no one ever thinks to check the far field mesh resolution because all of the text books just focus on y+.....
In your case, there is an error, and that's (probably) where the oscillation comes from. If the information you want/need isn't being altered by the higher aspect ratio, the error may be small, but it's not a value I can comment on without doing a much more indepth review: I'm not able to do that.
If you run with a lower near wall resolution (no inflation) but then adapt the near wall mesh how does that result compare to the others?
-
January 23, 2024 at 10:45 pm
w.u.maddumage
SubscriberHi Rob,
I looked into what you suggested. But unfortunately, the results don't seem to improve. I created a poly mesh with no boundary layers. As I'm using the SST omega model, the most important boundary, i.e. heated metal geometry and fluid is maintained at a max y+ of 1.4 with a fine mesh. All other walls max y+ is 2.3. The poly meshes have an aspect ratio of around 15 (I was not able to reach 1 with fluent meshing, because in the watertight workflow the mesh can only be improved considering ortho or skewness quality).
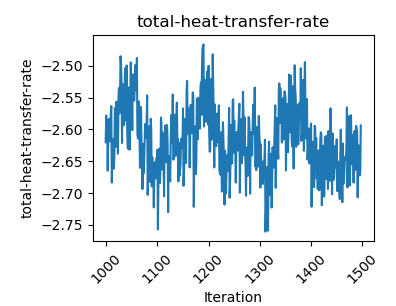
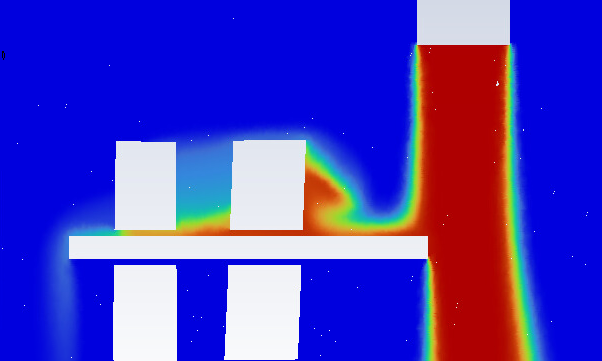
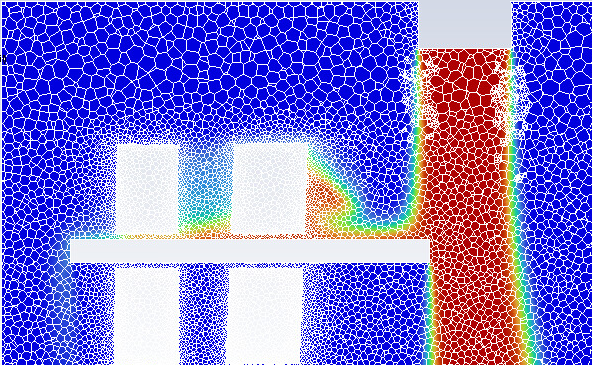
I ran several cases with adaptive meshing (with predefined multiphase settings), by changing the minimum cell length for refinement. Below are the two cases with the most and least fine meshes.
- Case A, the minimum cell length is 1e-5m (0.01mm). 20M cells
- Case B, the minimum cell length is 1e-4m (0.1mm). 6M cells
With the y+ around 1, and a low aspect ratio starting mesh moving to adaptive meshing, I expected that the case now can resolve both the boundary layer and along the wall well. However, case A shows more instability and error compared to case B.
Case A,
Case B,
Please, let me know if you have an idea what is going on here.
Thank you,
Waruna
-
January 24, 2024 at 9:08 am
Rob
Forum ModeratorIt's odd that you've got more VOF diffusion in the finer mesh. What you're seeing is likely some change in wetting effect, and given the significant difference in density, cp etc that'll easily give rapid jumps in values. Try running the 6M cell mesh with transient and see how it behaves.
-
January 25, 2024 at 7:32 am
w.u.maddumage
SubscriberHi Rob,
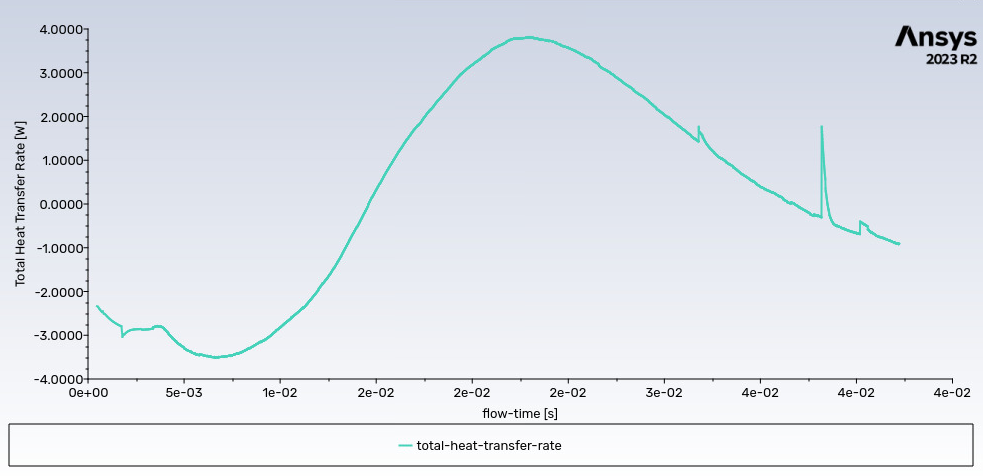
I started a transient from the last steady state results of the 6M cell mesh. With adaptive time stepping, I ran around 4000 time steps, total flow time of the simulation = 0.04s.
The total heat transfer rate graph is stable in the transient solution. But it shows a high error. The user energy source here is 2.6W. As you can see the graph deviates a lot from -2.6 W.
I should note that the convergence of the solution is much better with the transient. With the steady state, I was not able to bring continuity residuals below 1e-3. But with the transient, every step reaches convergence within 2 to 5 iterations.
Please let me know if you need more data on the transient results.
-
January 25, 2024 at 9:07 am
Rob
Forum ModeratorGive it more time, with the transient solution you're also (I suspect) going to see a much better defined free surface.
-
February 4, 2024 at 8:47 pm
w.u.maddumage
SubscriberHi Rob,
I ran the case for nearly 1s (flow time). Even though the heat transfer rate is not as unstable as before, it is not reaching a settled state. Interestingly, when I compared the total mass flow rate graph to the heat transfer graph, they appeared identical. Additionally, the temperature of the metal geometry remained constant throughout the simulation, which is a crucial variable for us. The residuals also behaved very well throughout this time frame, consistently converging within two time steps.
Could the variation we see in heat transfer and mass flow rate is not because of noise or lack of convergence in the simulation, but rather because the fluid volume in the domain is not constant in the real scenario? Could these discrepancies be explained by fluctuations in the fluid volume within the domain, possibly caused by non-uniform fluid flow through the geometry, resulting in an inconsistent flow output from the domain?
Or have I completely misread the situation and there is something seriously wrong with the simulation?
-
-
February 5, 2024 at 10:29 am
Rob
Forum ModeratorLooking at those graphs you've not reach an equilibrium state, so whilst the results are likely correct they may not be what you're looking for.
-
- The topic ‘Unstable total heat transfer rate and total mass flow rate’ is closed to new replies.


-
4607
-
1510
-
1386
-
1209
-
1021

© 2025 Copyright ANSYS, Inc. All rights reserved.

