General Mechanical

General Mechanical

Topics related to Mechanical Enterprise, Motion, Additive Print and more.

Graph for Amplitude growth at resonance

    • Hassan.liaquat
      Subscriber

      I performed a modal analysis of multiple similar systems using Ansys Modal, after identifying frequencies with the highest participation factor and effective mass-to-mass ratio for each system. However, some systems' fundamental frequencies are near to another system's eigenfrequency. 

      Now, I want to check the response of each system at the fundamental frequency of system 1, that is, how fast the amplitude of each system increases at the fundamental frequency of system 1. For that, I need each system's amplitude vs time graph, as shown in the sketch below. I am trying transient structural, but I am encountering two issues: how to give force. The force will be an ultrasonic force with a frequency equal to the fundamental frequency of system 1, say 66000 Hz, and an amplitude of 0.8 uN. How do I input this force in transient structural as a function?

      What should be the step control for this? I want to observe, let's say, one pulse of ultrasound carrying ten cycles of the wave.

    • Erik Kostson
      Ansys Employee


      Hi

      You can use tabular loading for the force or function (force vs time) option:

      For the tabular loading you can copy paste data from excel into the  force tabe in ansys.

      /forum/forums/topic/cyclic-loading-from-ansys-workbench/

      Function:

      https://www.youtube.com/watch?v=AGpE0Ycdvvk (see here when they apply the force as function)


      For time step, we use dt=1/(10*fmax) where fmax is here the ultrasonic excitation frequency I suppose (66 kHz).


      All the best

      Erik


    • Hassan.liaquat
      Subscriber


      Hi Erik,


      I tried to follow the video link you shared (

      )

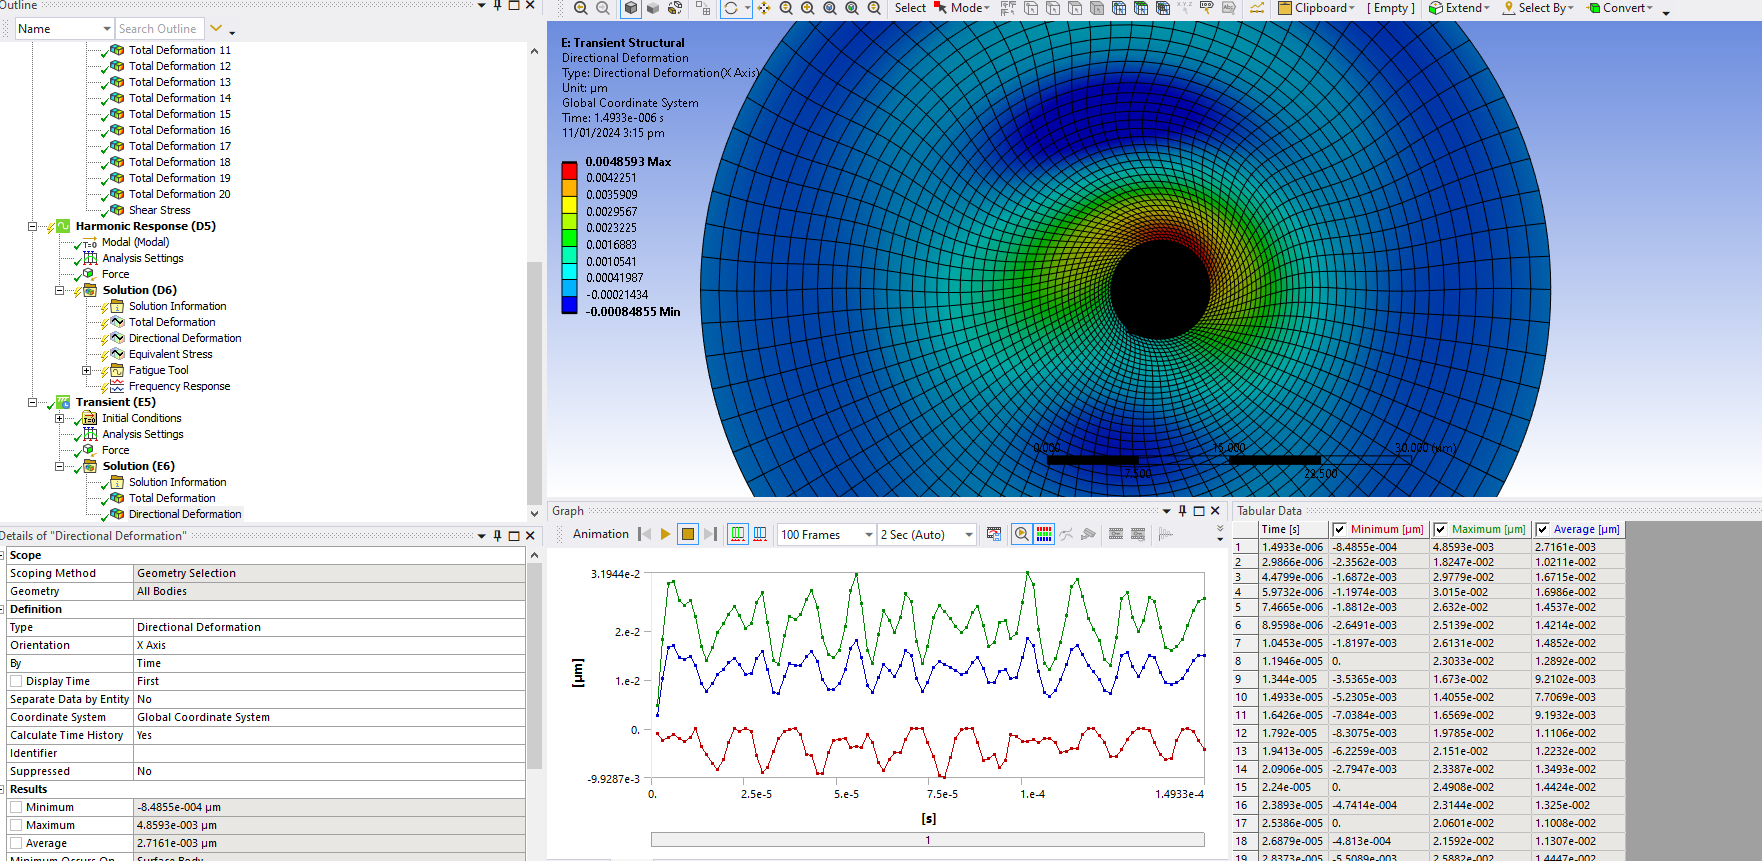
      I am applying a force at an ultrasonic frequency, so I put force function = 0.08*sin(2*3.14*66964*step end time). I put time equal to the step end time.

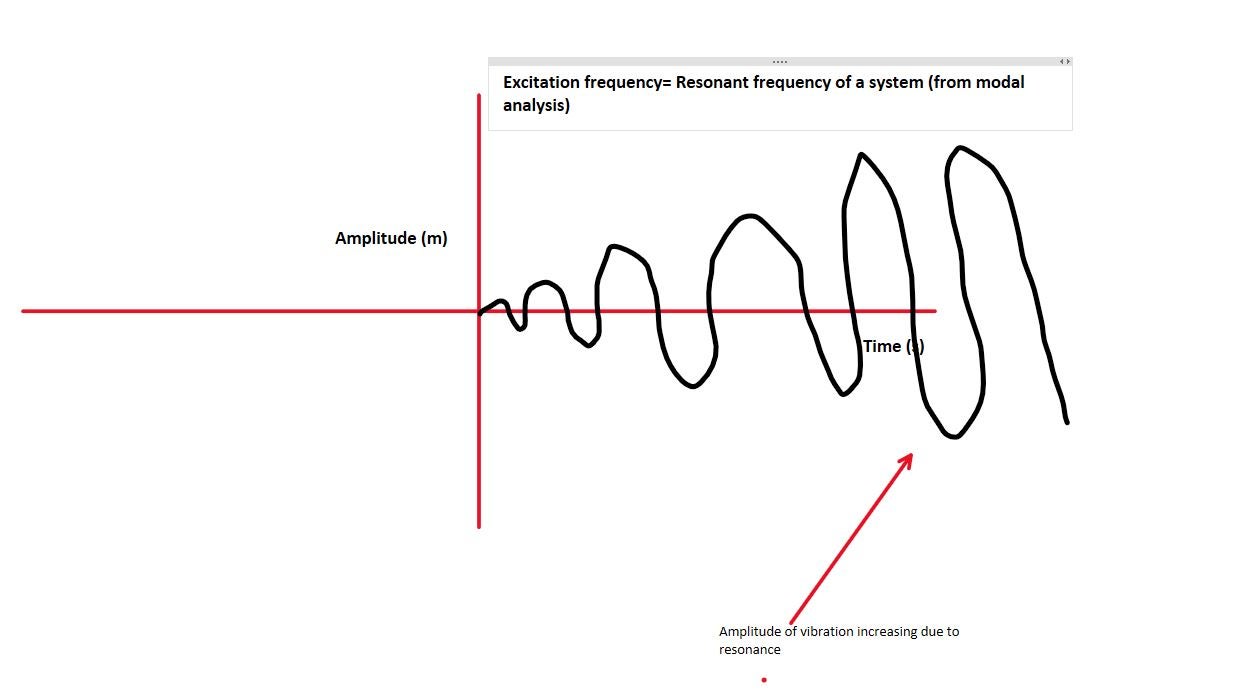
      When evaluating directional deformation i.e., in the direction of force of excitation, this is what I got. Although it gives some idea of the body fluctuating about mean zero, the amplitude does not seem to increase with time, although it’s the resonant frequency of the body with maximum PF and effective mass ratio among all modes. Geometry is a 2D circular solid (Smaller in the center) inside a fluidic body (Larger outer circle)


Viewing 2 reply threads
  • The topic ‘Graph for Amplitude growth at resonance’ is closed to new replies.