Ansys Assistant will be unavailable on the Learning Forum starting January 30. An upgraded version is coming soon. We apologize for any inconvenience and appreciate your patience. Stay tuned for updates.
Photonics

Photonics

Topics related to Lumerical and more.

Phase information extraction

    • berkay.neseli
      Subscriber

      Hello,

      I am working on designing a phase shifter and I have some questions about how to get the correct phase information in FDTD. In a previous post (/forum/forums/topic/extracting-te-mode-phase-information-using-fdtdport-on-the-waveguide/) I saw that phase information can be extracted by using ports. Also in this group delay example of Lumerical, phase info is extracted from time monitor (https://optics.ansys.com/hc/en-us/articles/360042800113-Group-delay-analysis). Is there a significant difference between them? Which one is more appropriate to use or if set up correctly, would both of these methods give the same result ? 

      As an initial setup, I used ports and tried to get the phase information by this script :

      port2S = getresult('FDTD::ports::output_port','S'); (It is my output port)

      a=port2S.S;

      deg=angle(a);

      In the definition of angle(x), it says that the angle command "Returns the angle or phase of a complex number or matrix in radians." But my data is not complex, then does this mean that I can't use this approach? 

      Thank you.

    • Amrita Pati
      Ansys Employee

      Hi Berkay,

      I apologize for the late reply. I believe the method used in https://optics.ansys.com/hc/en-us/articles/360042800113-Group-delay-analysis is only applicable to single mode waveguides. You may refer to the following article to see how the phase extraction is one from the S-paramater:Y-branch. In your case, if you go to the S-paramater result and change the scalar operation to Angle (as shown below), is the result 0 everywhere?

      Regards,
      Amrita

    • berkay.neseli
      Subscriber

      Hello Amrita,

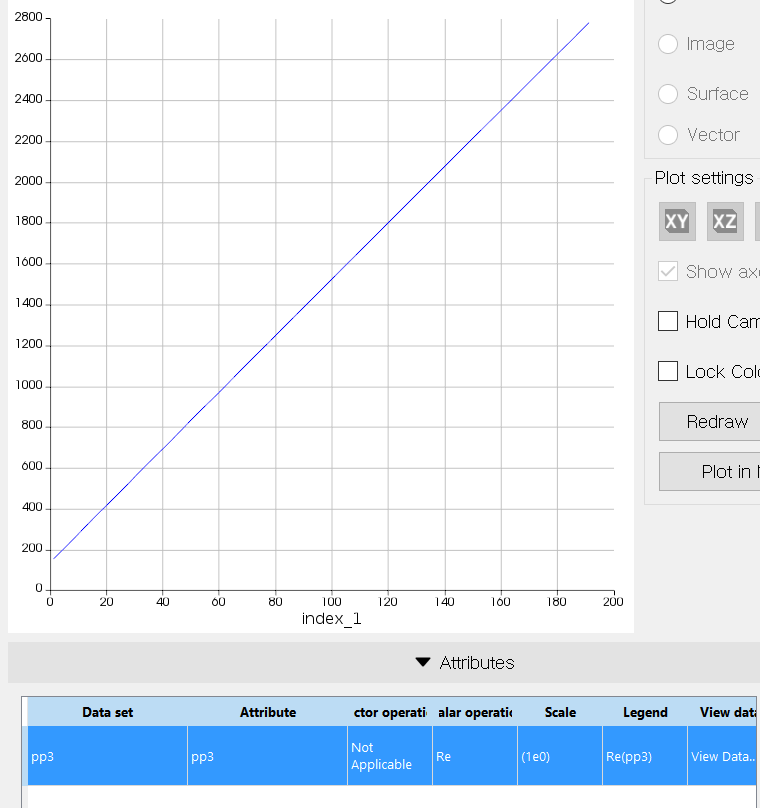
      Thank you for the reply. When I plot my result, it is not 0. It is like the example graph I obtained below.


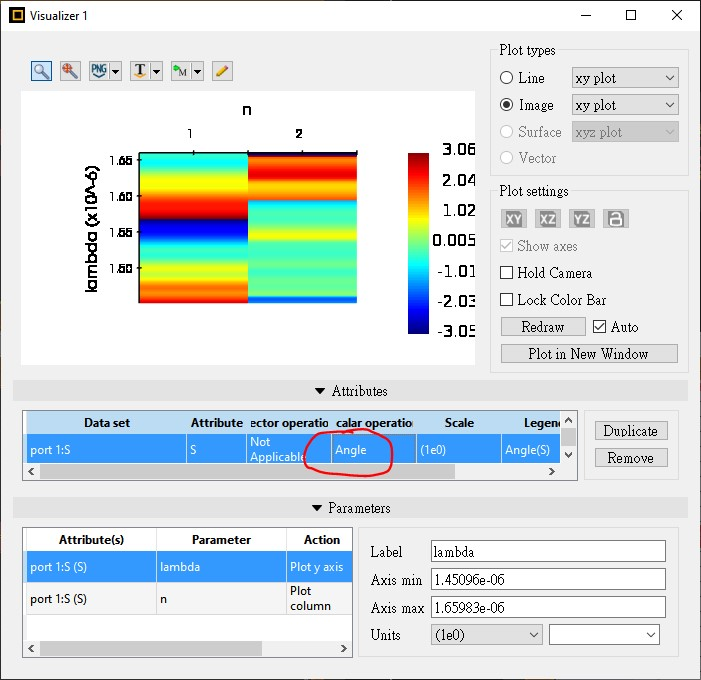
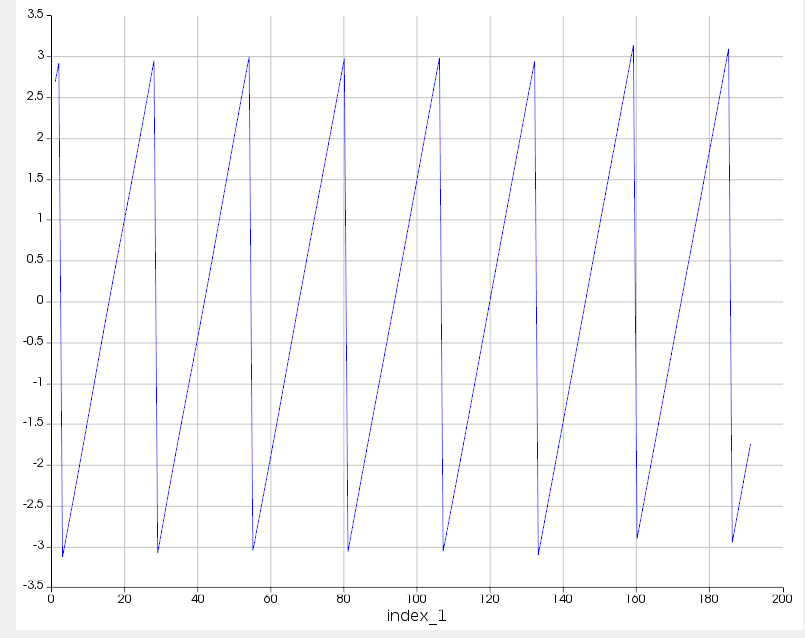
      But when I use the 'angle' command to extract the phase data, I get a graph like below (index is the number of my monitor wavelength points);

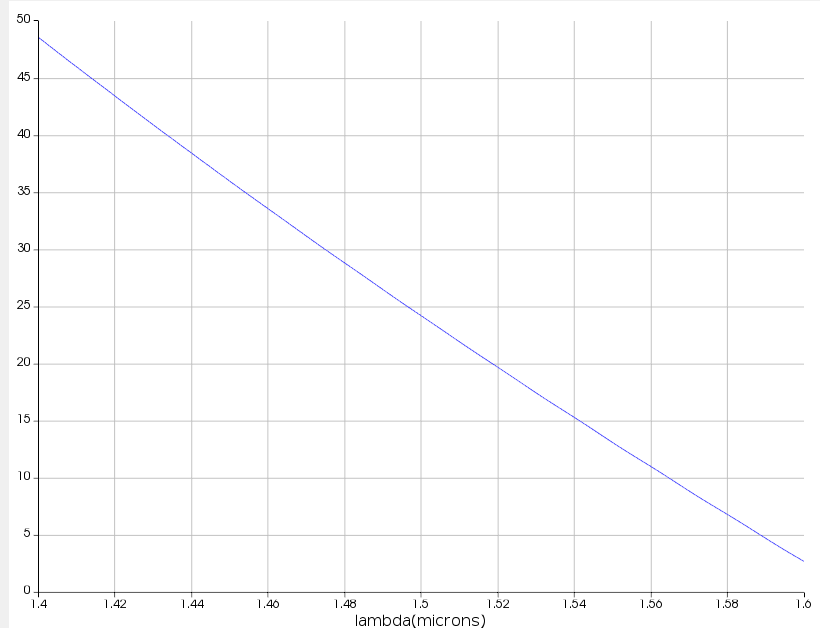
      And when I do only unwrap(angle(x)), I get the same result as the first graph. But when I do the unwrap(angle(x))*180/pi, the resulting plot is as below;

      The thing I am confused with is, shouldn't I use unwrap(angle(x))*180/pi? Doesn't this convert the phase from radians to angle? Or only unwrap(angle(x)) is enough? (x is the phase data's name which is extracted from the port).

      I will also check the example you suggested, I didn't had time to check it yet.


      Thank you.

    • Amrita Pati
      Ansys Employee

      Hi Berkay,

      I apologize for the late reply. This is a bit strange. There should not be unwrap(angle(x))*180/pi and unwrap(angle(x))* should not show any difference in the trend. Would you be paste your exact code here so that I can run it one of my example. 

      Regards,
      Amrita

Viewing 3 reply threads
  • The topic ‘Phase information extraction’ is closed to new replies.
[bingo_chatbox]