-
-
November 1, 2018 at 2:40 pm
Inims
SubscriberHi All  I have used photos for few descriptions for the issues I am having in trying to plot velocity vs time, pressure vs time, liquid vol fraction vs time. Please find attached. Kindly be of help and if you have further clarifications. Â
-
November 1, 2018 at 4:19 pm
Rob
Forum ModeratorAs ANSYS staff we're not supposed to open files, but as it's a pdf I've made an exception: in future please add images to the post.Â
I'm not clear as to what the problem is. Have you saved data at all of the steps you want to plot? Fluent does not retain data from previous steps in the final saved data file. I'd also suggest using monitors in Fluent to plot data at various positions during the run.Â
Â
-
November 2, 2018 at 2:08 pm
Inims
SubscriberHi rwoolhou,
I exported files to CFD Post using Calculation Activities. These include: absolute pressure, velocity magnitude, gas and liquid volume fractions. Then under report definitions I selected volume averages for absolute pressure, velocity magnitude and gas & liquid volume fractions. Also under monitors I plotted these variables versus flow time. That is absolute vs flow time, velocity magnitude vs flow time, gas vol fraction vs flow time and liquid vol fraction vs flow time. These are the attachment I submitted in my message.
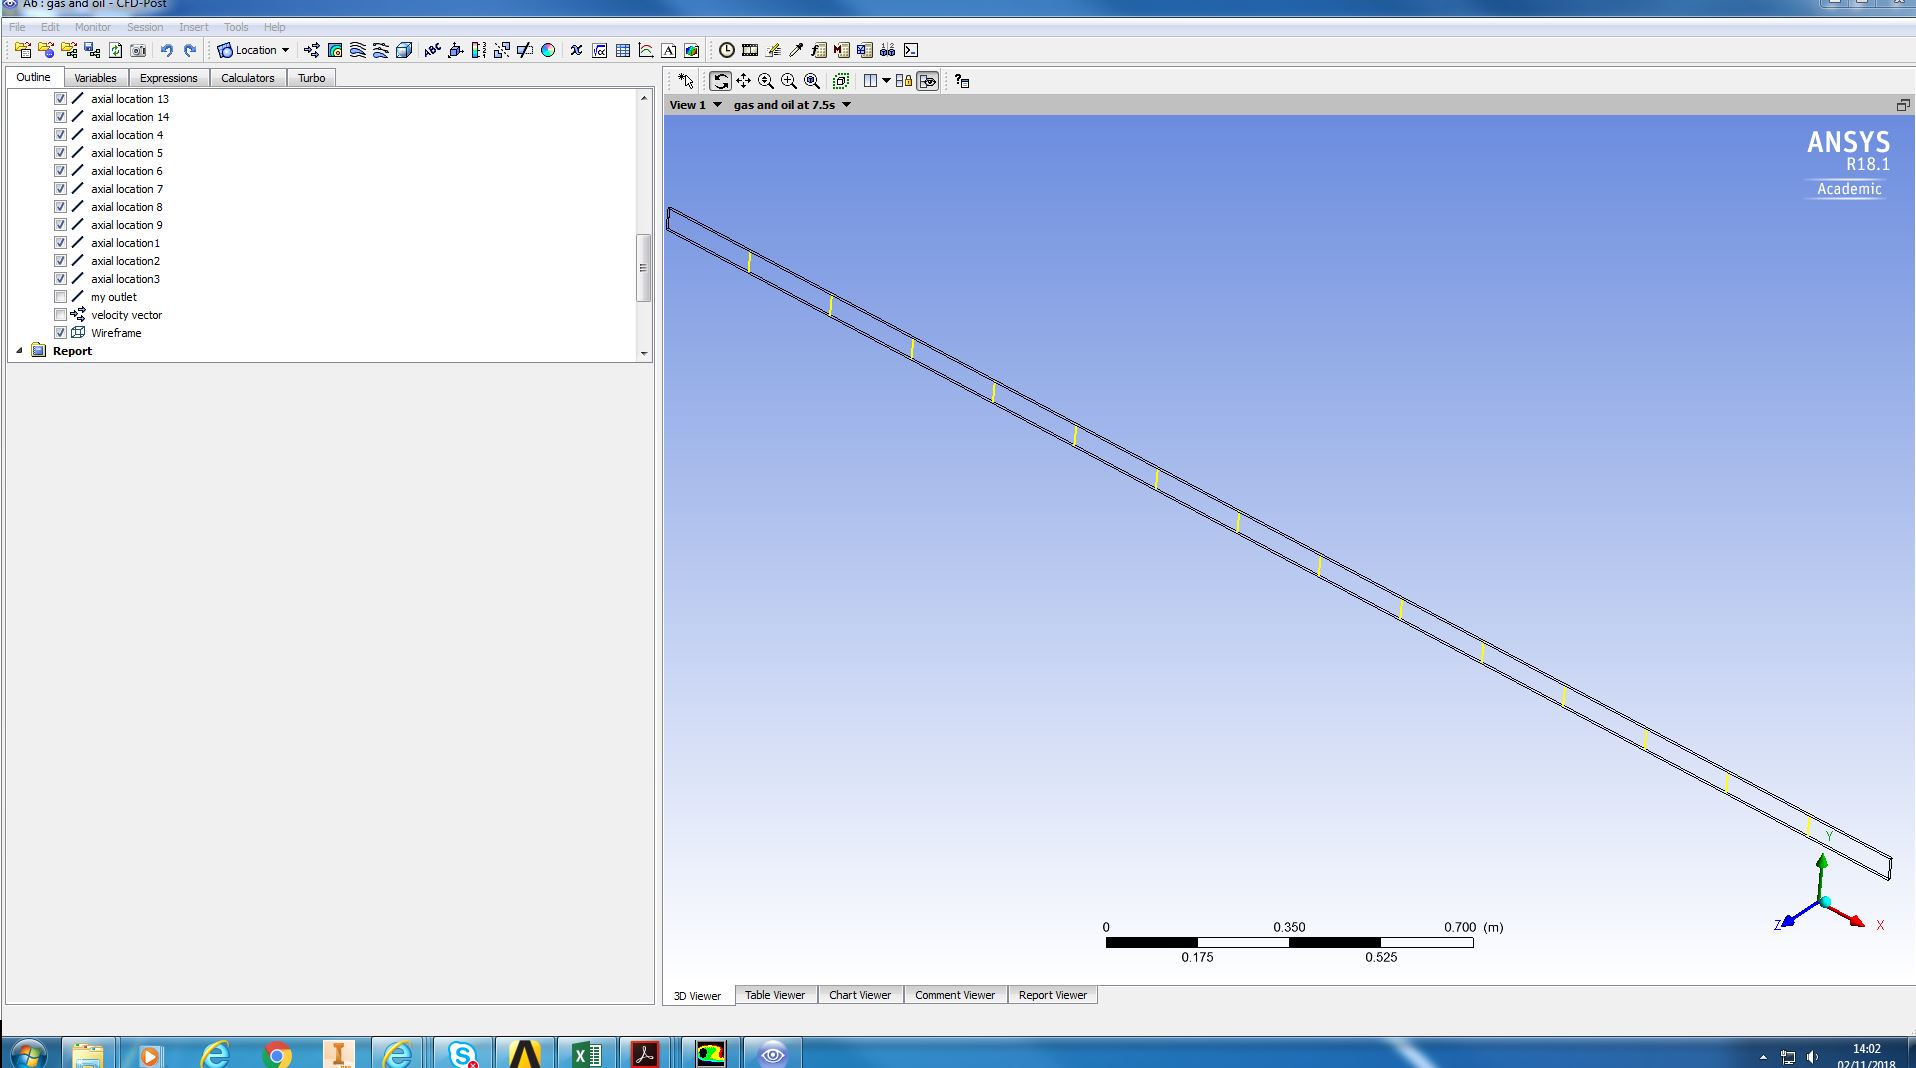
However, I divided the the 2D pipe into sections (I called Axial Locations 1,2...) in CFD post and I want to plot at these sections for velocity magnitude vs flow time, absolute pressure vs flow time etc just like I did for the full simulation of 7.5 seconds. This is position I am. Not been able to do this and need help. See snipped picture
-
November 2, 2018 at 3:58 pm
Rob
Forum ModeratorThe graph looks like it's not picked up any data (hence the 1000 by 1000 on the scale) so I'd check the data attached to x & y. Please can you include the images inline in future: we're also not supposed to open images: we have very tight rules for posting on here.Â
-
November 2, 2018 at 6:00 pm
Inims
Subscriber -
November 5, 2018 at 11:16 am
Rob
Forum ModeratorYou should be able to use an xy plot, just select the location (line) & variable.Â
-
- The topic ‘Plotting on section locations’ is closed to new replies.
- air flow in and out of computer case
- Varying Bond model parameters to mimic soil particle cohesion/stiction
- Eroded Mass due to Erosion of Soil Particles by Fluids
- I am doing a corona simulation. But particles are not spreading.
- Guidance needed for Conjugate Heat Transfer Analysis for a 3s3p Li-ion Battery
- Centrifugal Fan Analysis for Determination of Characteristic Curve
- Issue to compile a UDF in ANSYS Fluent
- JACOBI Convergence Issue in ANSYS AQWA
- affinity not set
- Resuming SAG Mill Simulation with New Particle Batch in Rocky
-
3882
-
1414
-
1241
-
1118
-
1015
© 2025 Copyright ANSYS, Inc. All rights reserved.