-
-
September 23, 2018 at 8:36 pm
-
September 23, 2018 at 10:10 pm
peteroznewman
SubscriberFabricio,
In Mechanical, you use Construction Geometry to create a Path to plot stress along that path. Here is the SimuTech group tutorial.
Regards,
Peter
-
September 26, 2018 at 3:30 pm
Rohith Patchigolla
Ansys EmployeeHello Fabricio,Â
As Peter suggested, you can get distance along the edge vs stress plot using Construction Geometry (Path).Â
If you want to have X-coordinate (and not distance along the edge) vs stress plot instead, you can create in the following way.Â
1. Create a Equivalent stress result along a path as Peter suggested
2. Create a User defined result along a path, with expression LOCX
3. Highlight both objects created above and create a Chart
4. In the created chart, change the X axis (under Chart Controls) from "Length" to this "User defined result" created in step 2 to get X-coordinate vs stress plot
You can also combine multiple Equivalent stress results (at multiple time points) into one chart.
Hope this helps.Â
Best regards,
Rohith
Â
Â
-
September 26, 2018 at 11:29 pm
Fabricio.Urquhart
SubscriberThank you!
To create a path, it is necessary to create a edge in the geometry. If you do not have the edge, the results do not recognize the path.
-
September 27, 2018 at 8:10 am
-
April 16, 2020 at 2:51 pm
Natalia
SubscriberHi all!
I am sorry for not opening a new thread (neither uploading a pic) but for some reason it is impossible since a few days ("Sorry an error occured"). Could you please help me to plot a stress in a function of edge length along a non-linear 2D edge? I need it to compare several simulation with different loads. I am guessing that I might need to get all the values on the nodes with the apdl commands but I don't want to search blindly. Could you please give me any hint?Â
-
- The topic ‘
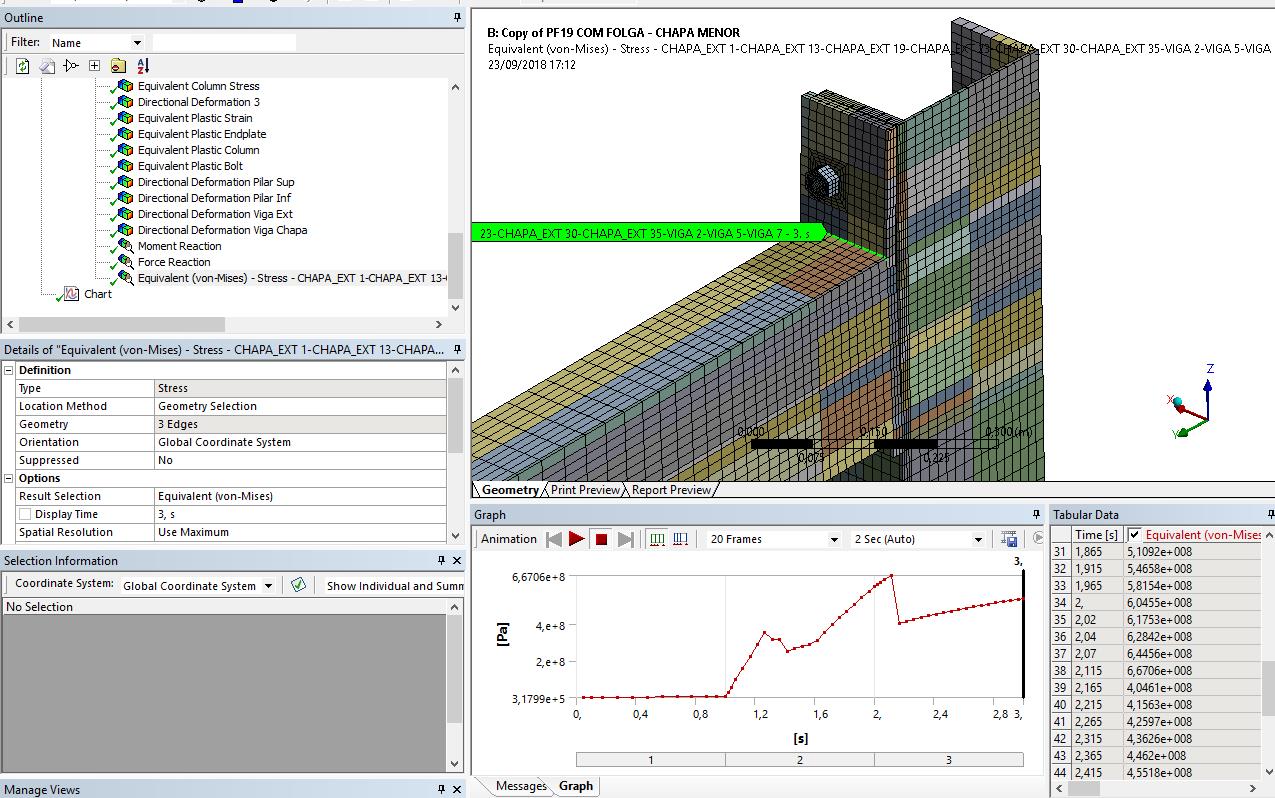
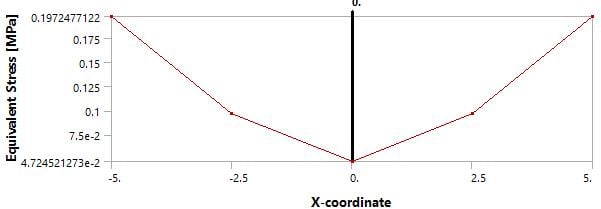
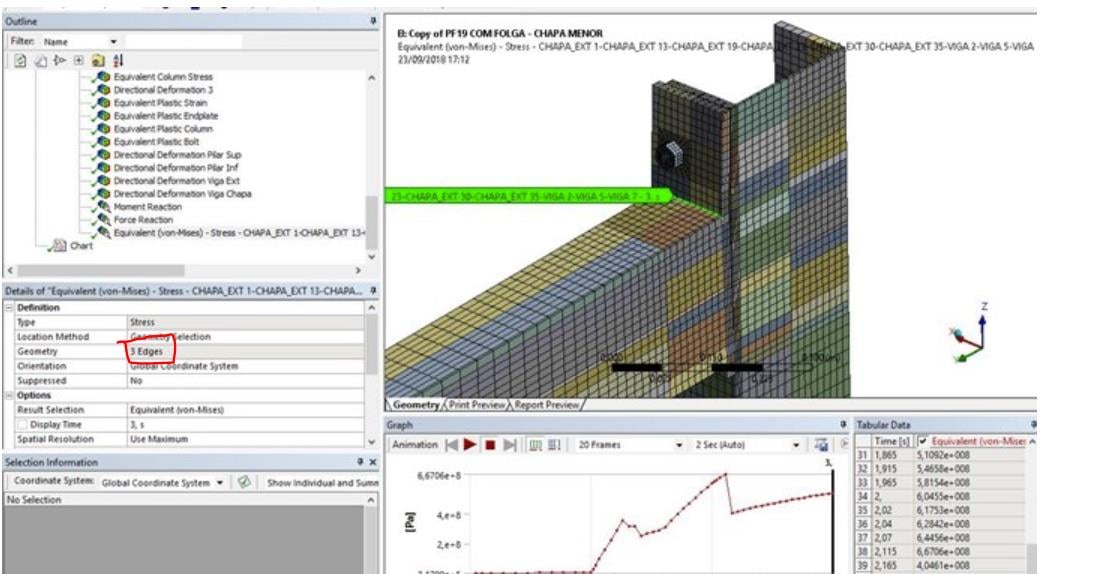
Plotting Von Misses Stress X Distance or Coordinate Node or Element’ is closed to new replies.
-
3832
-
1414
-
1208
-
1100
-
1015
© 2025 Copyright ANSYS, Inc. All rights reserved.