TAGGED: interconnect, lumerical, photonics
-
-
August 8, 2023 at 9:33 am
m.belchovski
Subscriber -
August 9, 2023 at 12:13 am
Dev
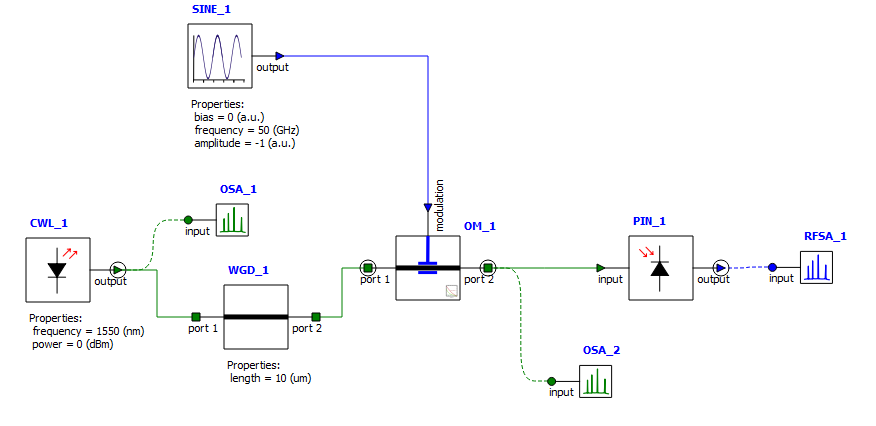
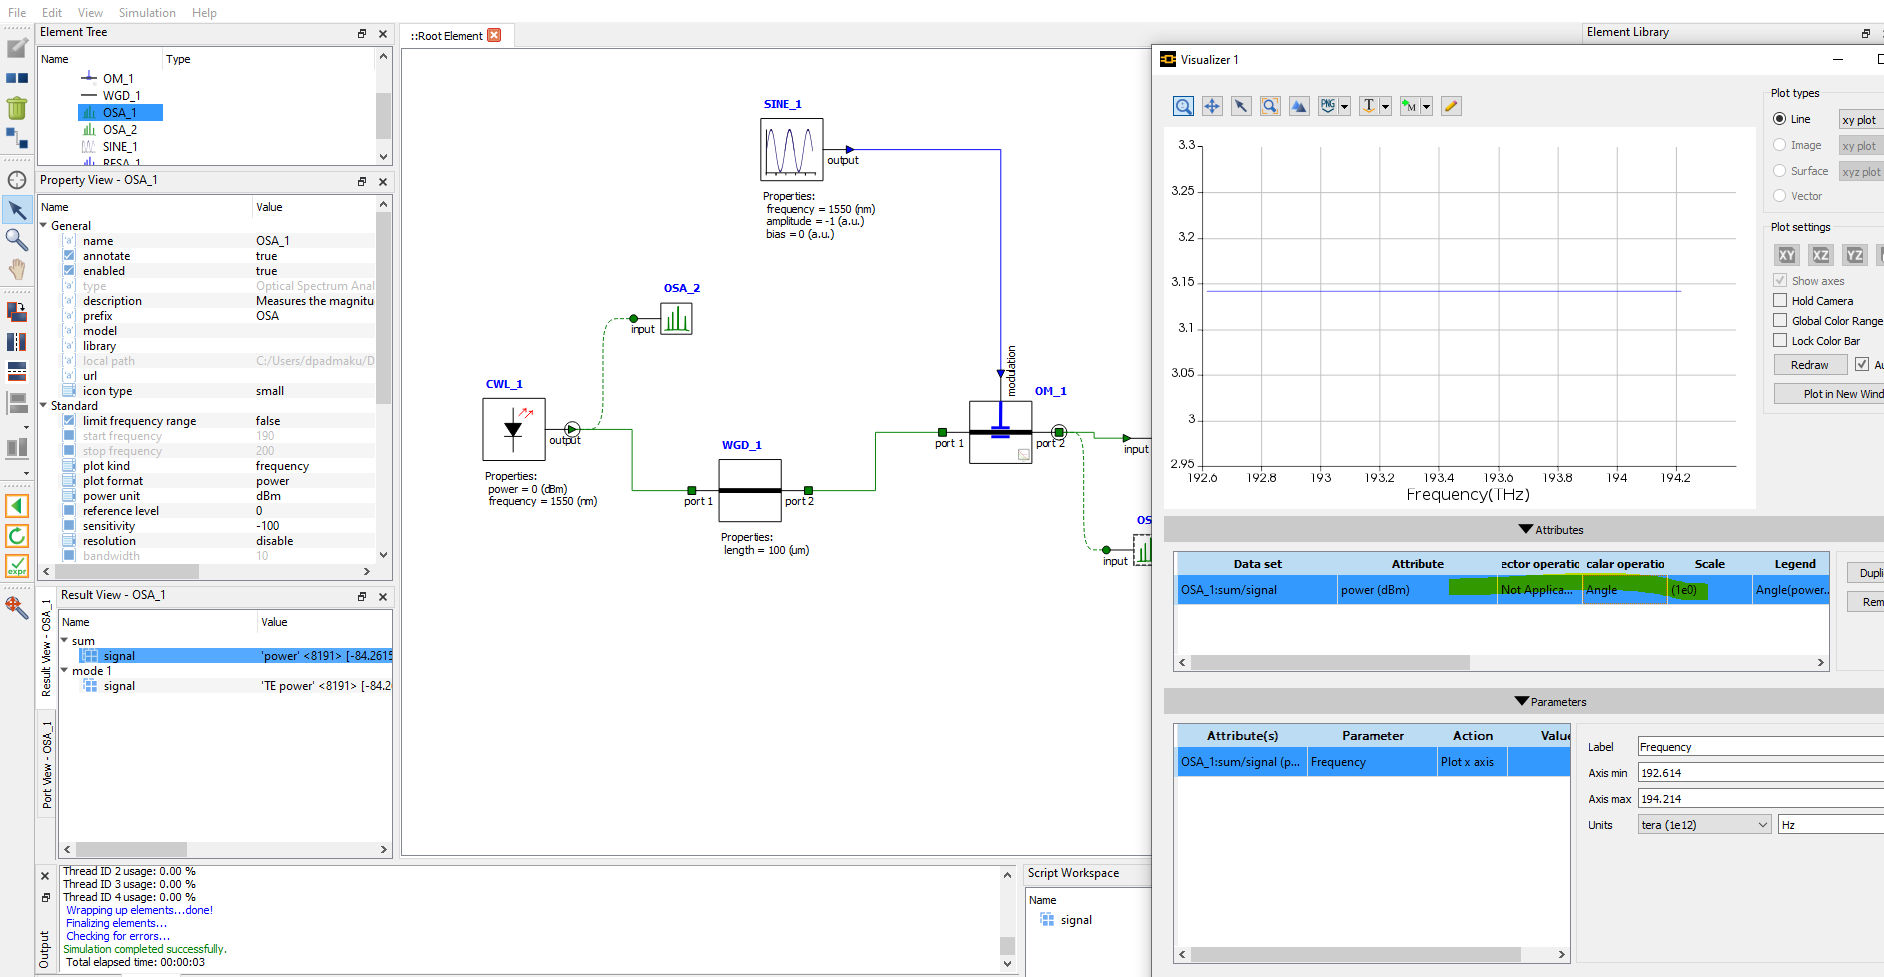
Ansys EmployeeHello, You can visualize phase from Result view visualizer. From drop down list under “scalar operation” select angle(see the picture below). The spectrum analyzer only returns power by default however, which is why the phase is zero. If you change the plot format property of the analyzer from power to rectangular then it will return the real/imaginary parts of the spectrum, so you can get the phase.
to know more: How to properly create a reciprocal phase shifter/modulator – Ansys Optics
Thank you
Devika
-
November 20, 2023 at 9:40 am
m.belchovski
SubscriberHi again,
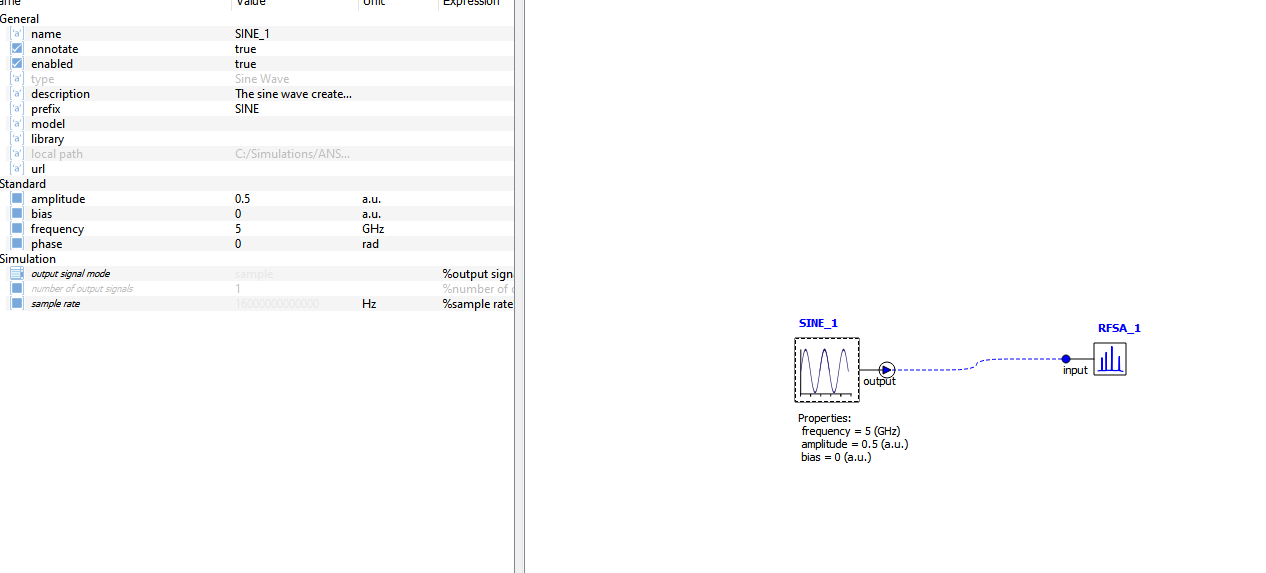
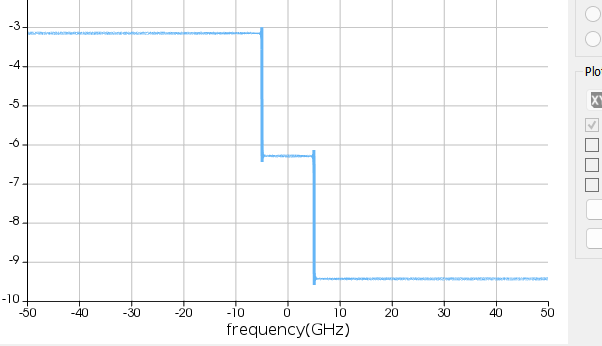
I have a follow up guestion. I do not understand how to interpret the results from the Angle scalar operation and I didn't find any instruction. For example, I have the most simplest possible system: a Sine wave generator, and a Electrical spectrum analyzer. For the spectrum analyzer I use the rectangular plot format and the angle scalar function to plot the phase(?). My initial phase is 0 rad (first results plot), and pi/2 rad (second results plot). Could you please help me with the interpretation of the plots? How can I verify that indeed I see 0 rad, and pi/2 rad on the angle plot?
Kind regards,
-
- The topic ‘How to check the phase of the optical spectral components in Interconnect?’ is closed to new replies.


-
4783
-
1565
-
1386
-
1242
-
1021

© 2026 Copyright ANSYS, Inc. All rights reserved.


