-
-
July 27, 2023 at 12:45 am
-
July 27, 2023 at 10:26 pm
Dev
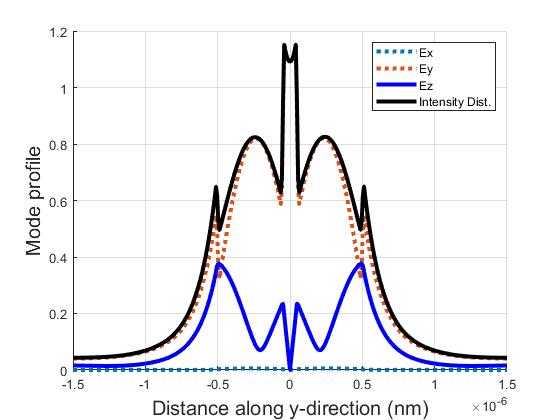
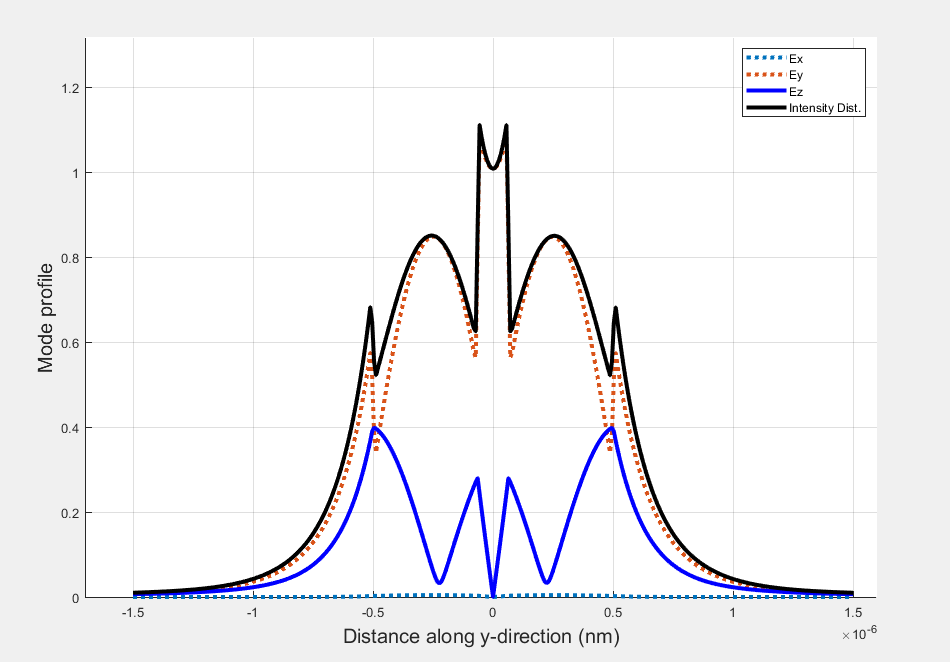
Ansys EmployeeHello, this seems not right.
Can you share more details on how you extratcted mode profile.
Also, plot the same graph using lumerical and let me know.
Thank you.
-
July 28, 2023 at 1:24 am
Z.Shahrabifarahani
SubscriberHi, thank you very much for your prompt reply!
This is the script I used to get the data for my monitor:monitor_name="1";
x=getdata(monitor_name,"x");
y=getdata(monitor_name,"y");
Ex=getdata(monitor_name,"Ex");
Ey=getdata(monitor_name,"Ey");
Ez=getdata(monitor_name,"Ez");
filename="Monitor_1";
matlabsave(filename,x,y,Ex,Ey,Ez);
And this is my matlab code to get this plot:m =((numel(MyData.x)+1)/2) + 1;
figure(i+1)
grid on
hold on
m = ((x+1) /2) + 1; #To get the central value of x which is the center of my stucture
E_x = Ex(m,:,1,3); # Ex(x,y,z,freq num)
E_x_abs = abs(E_x);
plot(x, E_x_abs,':', 'LineWidth',3)
grid on
hold onE_y = Ey(m,:,1,3);
E_y_abs = abs(E_y);
plot(x, E_y_abs,':','LineWidth',3)
grid on
hold onE_z = Ez(m,:,1,3);
E_z_abs = abs(E_z);
plot(x, E_z_abs,'b','LineWidth',3)
-
July 28, 2023 at 4:58 am
Dev
Ansys EmployeeThank you for sharing the code.
Which software you are using? I mean Mode or FDTD to generate mode profile? Which monitor are you using to generate mode profile?
Have you tried visualizing mode data in Lumerical software.
eg: I am using Eigen solver to generate mode profile of waveguide.
You can refer the following to extract the data: using getdata to grab mode profiles (ansys.com)
Thank you
-
July 29, 2023 at 8:13 am
-
July 29, 2023 at 8:24 am
Z.Shahrabifarahani
SubscriberBut I need to explain that I am using a lot of DFTMonitors is a single simulation with distance of a 0.5 um and 1 um to get the mode profile at different spaces of my structure.
I was wondering maybe too many monitors in a single simulation is generatig this error!
Here is my waveguide structure (an optical nanofiber with a polygonal cut throuth it). -
July 30, 2023 at 11:34 pm
-
July 31, 2023 at 3:34 pm
Dev
Ansys EmployeeHello,
DFT monitor records data for specified wavelength. The data is a mixture of all modes that were excited during the propagation. So the monitor might not be a good way to get the result.
I would suggest to usemode source and mode expansion monitor to get mode profile and S parameter or a or b coefficient to calculate mode amplitude.
Note 1 : If there is propagation and waveguide changes, the field profile is not a single mode. mode expansion monitor or port should be used to decompose the monitor data
Note 2: FDE also produce nomalized results if cross section of waveguide is uniform. But in your simulation its not the case.
Hope this helps.
-
August 1, 2023 at 6:51 am
Z.Shahrabifarahani
SubscriberThanks for the explnation.
-
August 1, 2023 at 7:12 am
Z.Shahrabifarahani
SubscriberBut using the FDE solver is NOT a suitable solver for my case, as based on the explanation in your website, the cross-section of the waveguide should remain uniform, which is not the case in my simulation.
-
August 1, 2023 at 7:24 am
Dev
Ansys EmployeeYes. You are right.
So the possible solution will be "using mode source and mode expansion monitor to get mode profile and S parameter or a or b coefficient to calculate mode amplitude".
-
August 1, 2023 at 7:27 am
Z.Shahrabifarahani
SubscriberGreat, Thanks!
I am currently using mode source, but I will try mode expansion from now on.
-
- The topic ‘Mode profile’ is closed to new replies.


-
4678
-
1565
-
1386
-
1242
-
1021

© 2025 Copyright ANSYS, Inc. All rights reserved.


