TAGGED: ls-opt
-
-
July 22, 2023 at 10:48 am
Deepak Kumar
SubscriberHello Everyone,
I am new to LS-OPT. I want to do a Metamodel-based optimization with SRSM.
My objective is a single .txt file (root mean square of 2 curves).
And i have given the constarints as 0 lower bound and 0.0175 as upper bound for the same text file.Out of these 3 green points i want it to plot the best curve in histories.
but when i do that its empty.
Note: If i select only feasible it displays all 3 curves.
Could you please tell me what i am doing worng so that i can rectify.
Thank you. -
July 24, 2023 at 4:36 pm
igandiko
Ansys EmployeePlease select "only best computed".
You can also go to "History" plot and plot all the three feasible (green) designs and the test curve simultaneously to see which one closer to the test curve. You can click on each computed curve to check its MSE value.Â
-
July 25, 2023 at 7:27 am
Deepak Kumar
SubscriberHello,
Thank you for the inputs.But, is their a possibility to display the best curve amongst the optimized curves?
My requirement is that it displays only one best optimized curve. -
July 26, 2023 at 3:47 pm
igandiko
Ansys Employee
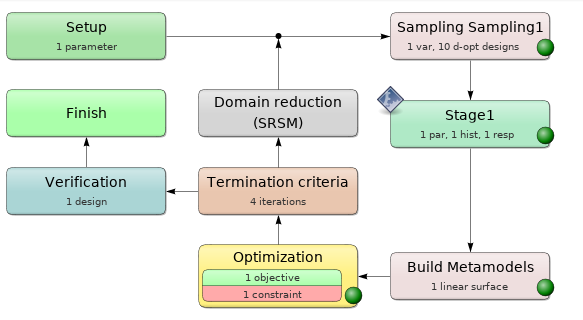
If you ran all 4 iterations, please look at history of 5.1 design. This design is the ls-dyna (computed) result of optimum predicted by the metamodel in iteration 4. If metamodel is accurate, design 5.1 will be the best optimized curve.Â
Note that, if the metamodel is not accurate, it is possible design 5.1 may be worse than other computed designs and you may have to run more iterations. Optimization history plot should show the accuracy/difference in MSE between computed optimum and predicted optimum.
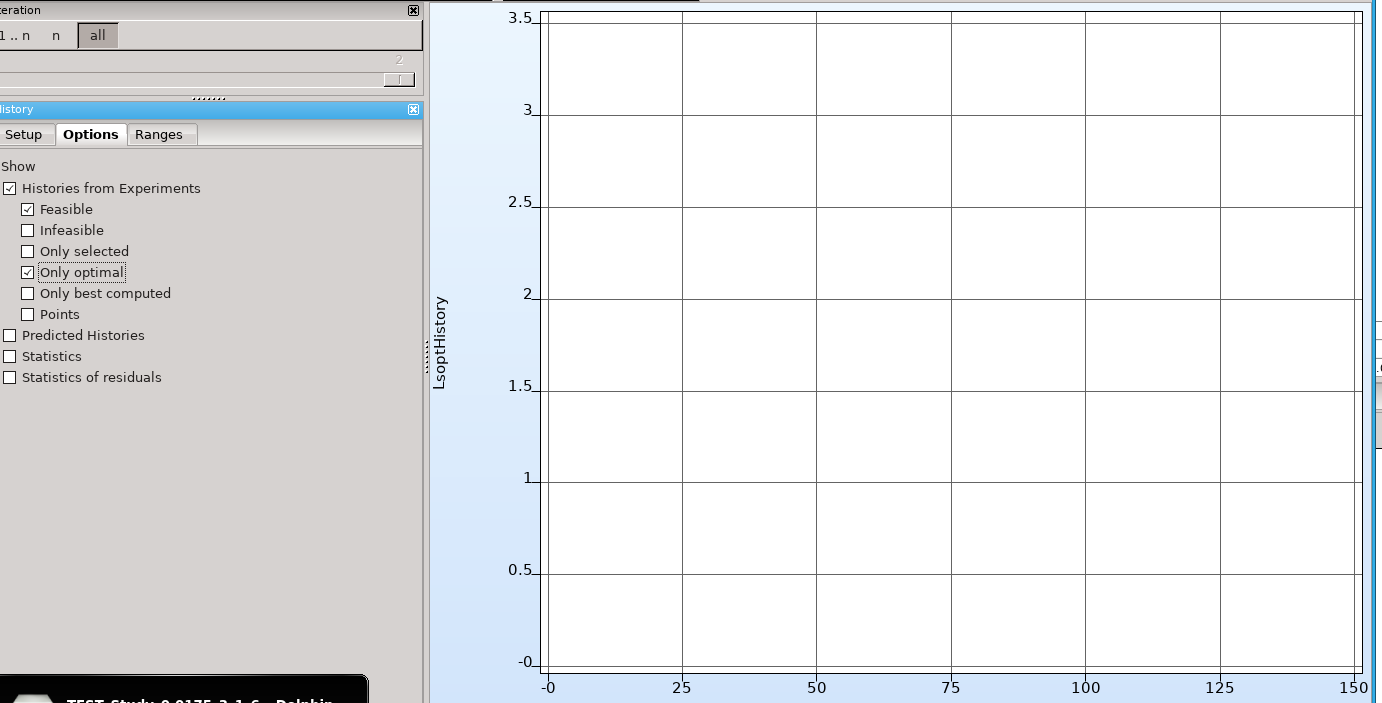
History plot under "Metamodels" in the viewer can be used to plot predicted histories.
-
July 28, 2023 at 4:14 pm
Deepak Kumar
SubscriberThank you for the inputs.
i will try it out.
-
- The topic ‘LS-OPT – Metamodel-based Optimization’ is closed to new replies.
-
3572
-
1188
-
1076
-
1063
-
952
© 2025 Copyright ANSYS, Inc. All rights reserved.