-
-
July 7, 2023 at 3:03 pm
ebilalis
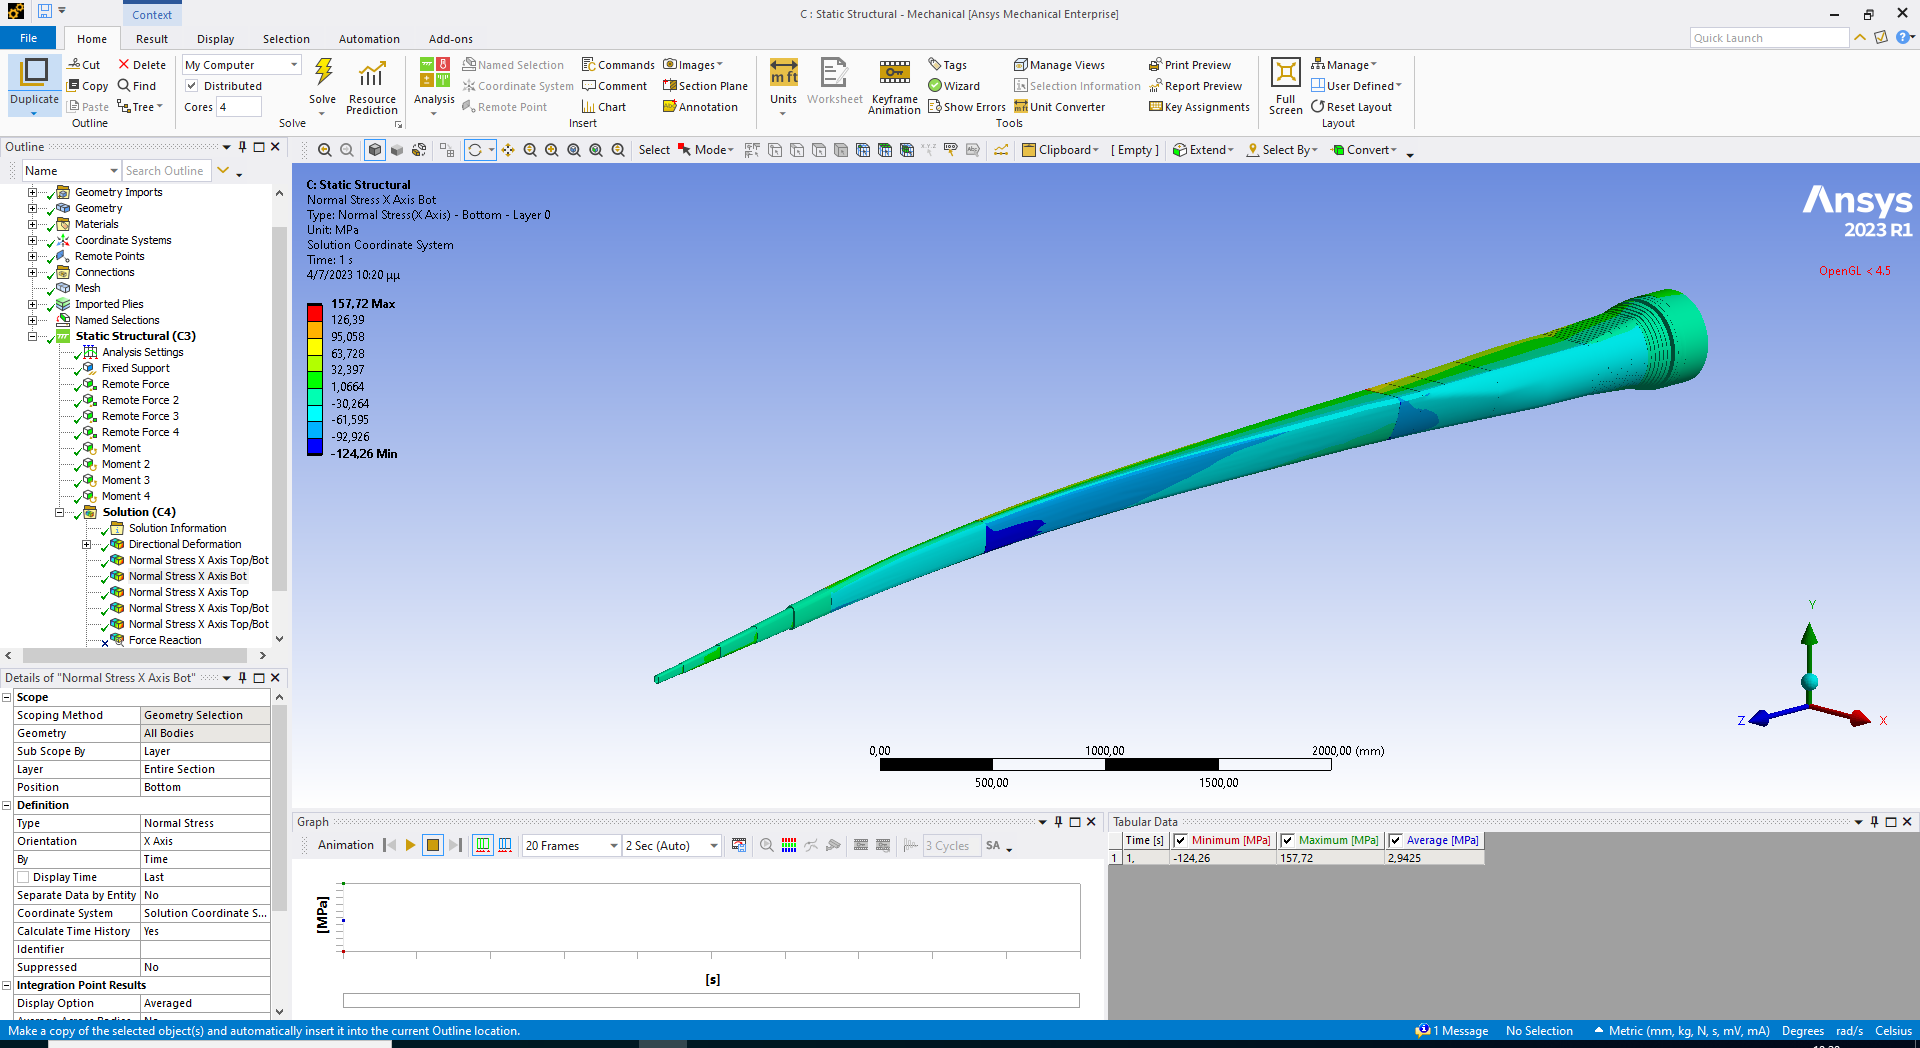
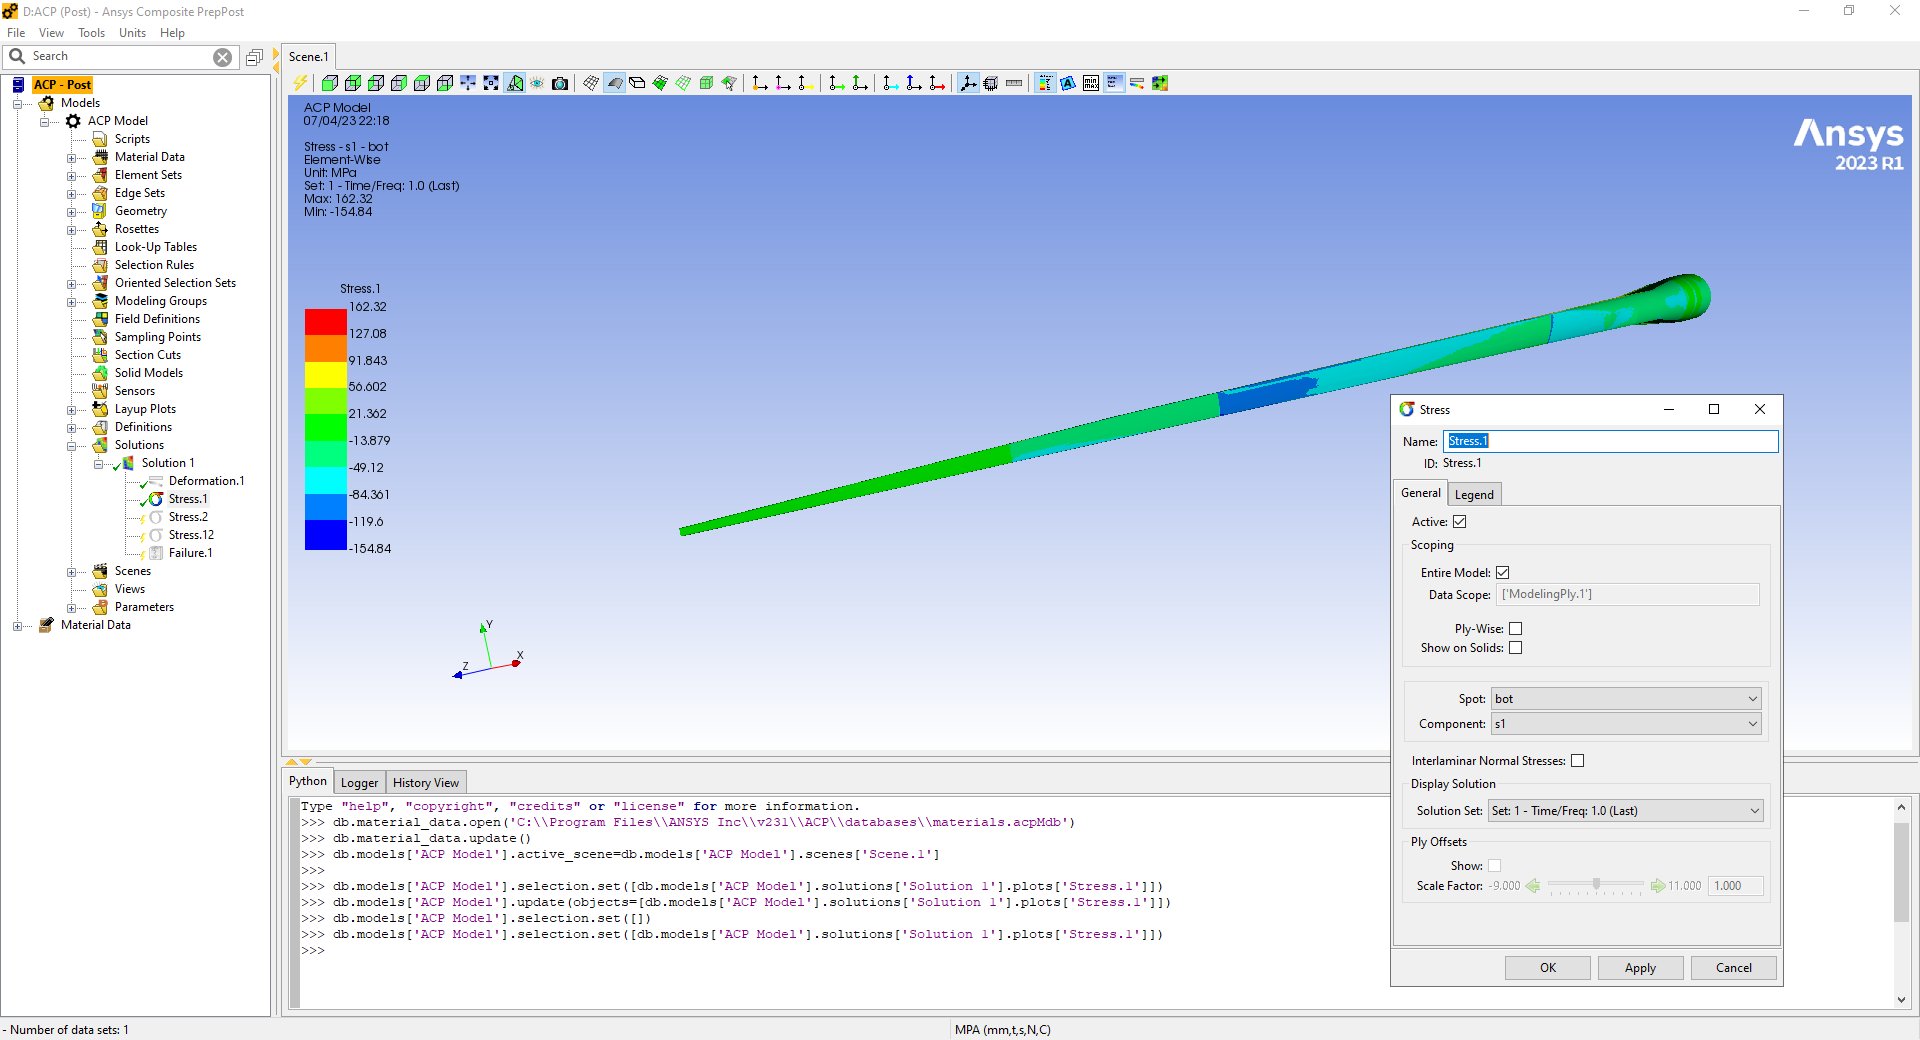
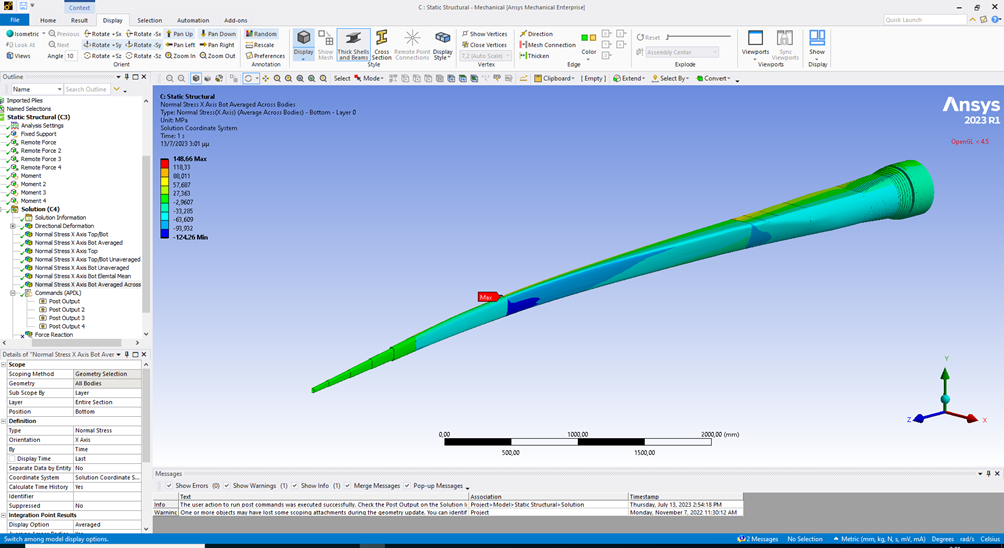
SubscriberI am trying to understand why there is a difference between the results of Normal Stress in the X-axis of the solution coordinate system at the Bottom of the Entire Section calculated by Mechanical and the stress S1 at the Bottom of the Entire Model calculated by ACP. They are close but not the same, as it can be seen in the two figures below. Thank you in advance for your help.
-
July 10, 2023 at 10:07 am
Lydia Lymperopoulou
Ansys EmployeeHello Elias,
The differences in the stress results from the static structural model and the ACP model could be due to the way these tools calculate and display results. In the ACP model:
- ACP Sampling Point and ACP Plot show stress/strain at the element center. The values are interpolated from the elements' integration points. This approach is similar to the "elemental mean" display that can be done in Mechanical
- The Inverse Reserve Factor (IRF) calculation is based on the worst value of all integration points, to present the most conservative case
Therefore, variances in results between the static structural and ACP could be attributed to these differences in calculation and representation methods.Hope this helps,
Lydia
-
July 13, 2023 at 12:11 pm
ebilalis
SubscriberHello Lydia,
Thank you very much for your answer.
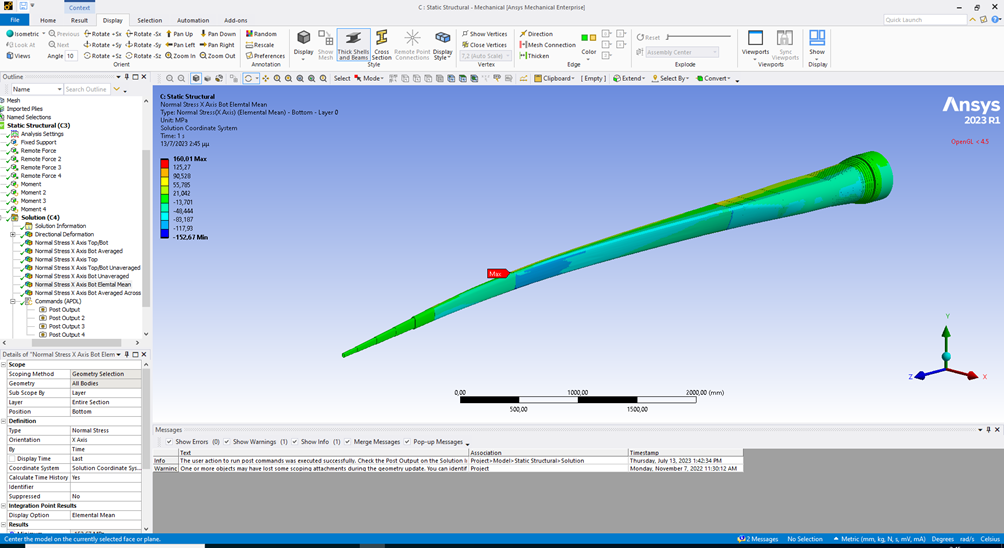
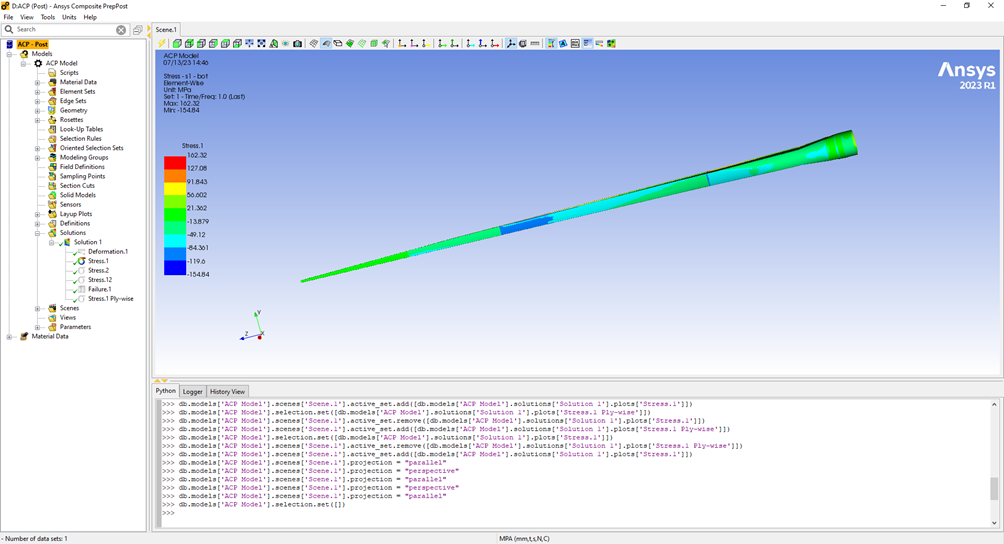
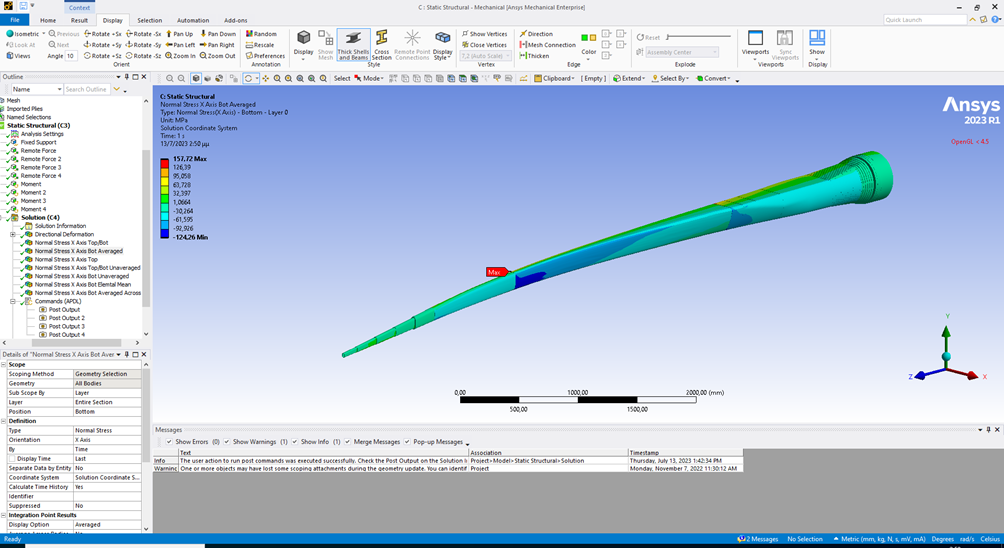
I tried the Elemental Mean Display Option in Mechanical (fig. 1) and the discrepancy compared to ACP’s results (fig. 2) is 1.44% instead of 2.92% for the Averaged Display Option (fig. 3). So, the difference is lower but still exists.
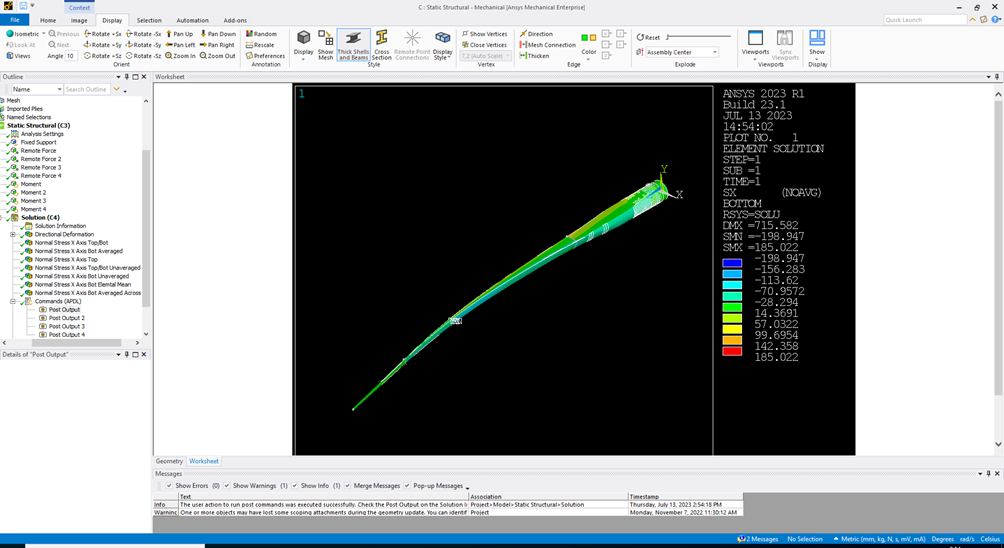
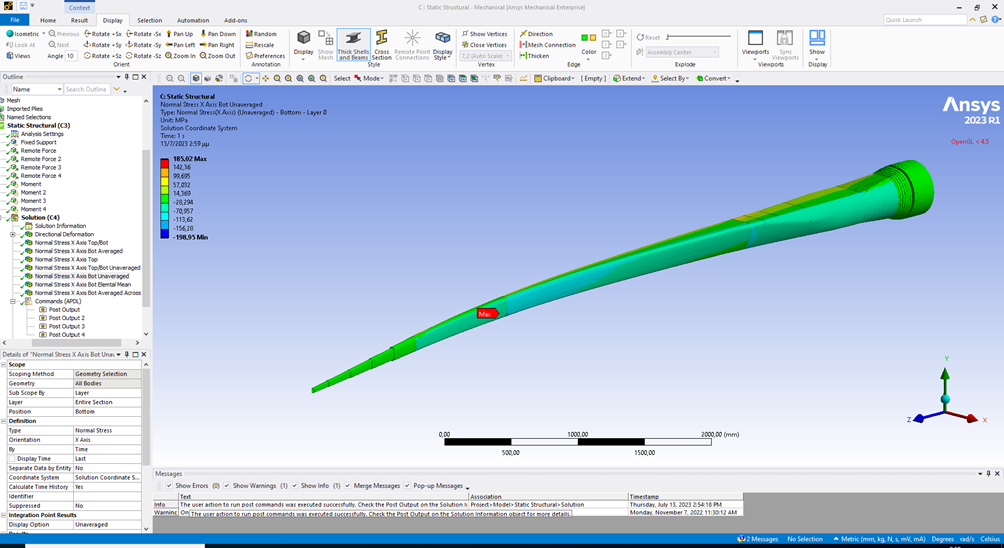
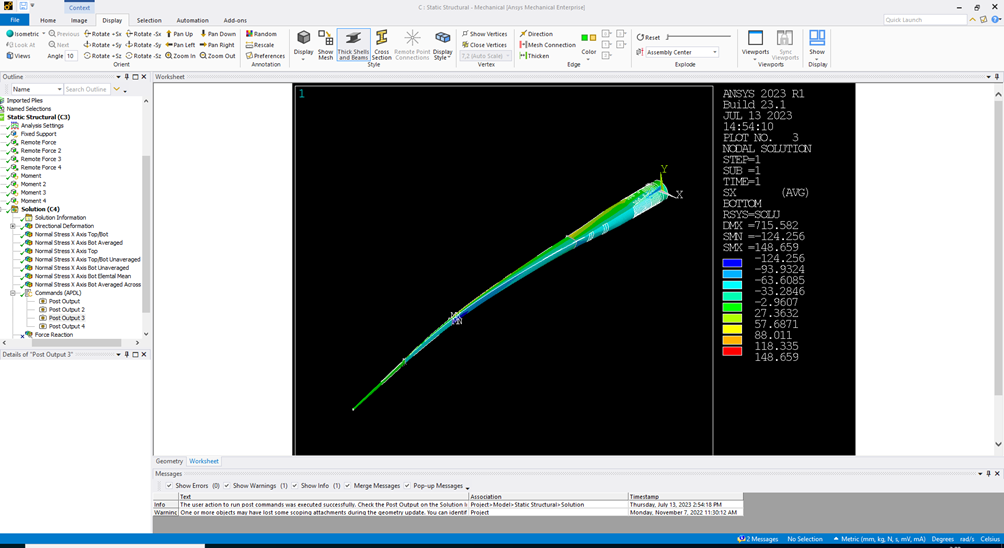
I went a bit deeper and plotted the results of Mechanical APDL for the corresponding Element Solution (fig. 4) and Nodal Solution (fig. 6) with Graphics set to Full (not Power). The maximum and minimum of the Element Solution Results from Mechanical ADPL are the same with the Results from Mechanical using the Unaveraged Display Option (fig.5), as expected, but the maximum of the Nodal Solution Results is 10MPa lower than the maximum from Mechanical using the Averaged Display Option (fig. 2). To get the same result in Mechanical, I had to also enable the Average Across Bodies option (fig. 7).
I am really curious about these discrepancies in the results of ACP, Mechanical and Mechanical APDL and I am wondering if they can match each other with a particular set-up. And more importantly, I would like your opinion on which ones are the more realistic to use. If I was using Mechanical APDL, I would probably use the Nodal Solution Results, which, however, predict the lowest maximum stress.
Thank you in advance for your time.
Elias
-
- The topic ‘Difference between Normal Stress in X-axis in Mechanical and Stress S1 in ACP’ is closed to new replies.


-
5059
-
1765
-
1387
-
1248
-
1021

© 2026 Copyright ANSYS, Inc. All rights reserved.

