-
-
June 24, 2023 at 7:53 pm
sagar
Subscriber -
June 26, 2023 at 10:16 pm
Guilin Sun
Ansys EmployeeI would suggest to check the matrix dimensions to identify which one is for Height or lambda. You can dirfectly plot the numbers (eg, use 1:N_height and 1:N_lambda) to plot, wherer N_ is the dimension length. Please check the command from matlab as different command may arrange the data differently.
Usually if you save the dataset from Lumerical to .mat then in matlab the read the data as it is. Since this is 3rd party tool it is hard for us to check for it.
-
July 3, 2023 at 11:56 am
sagar
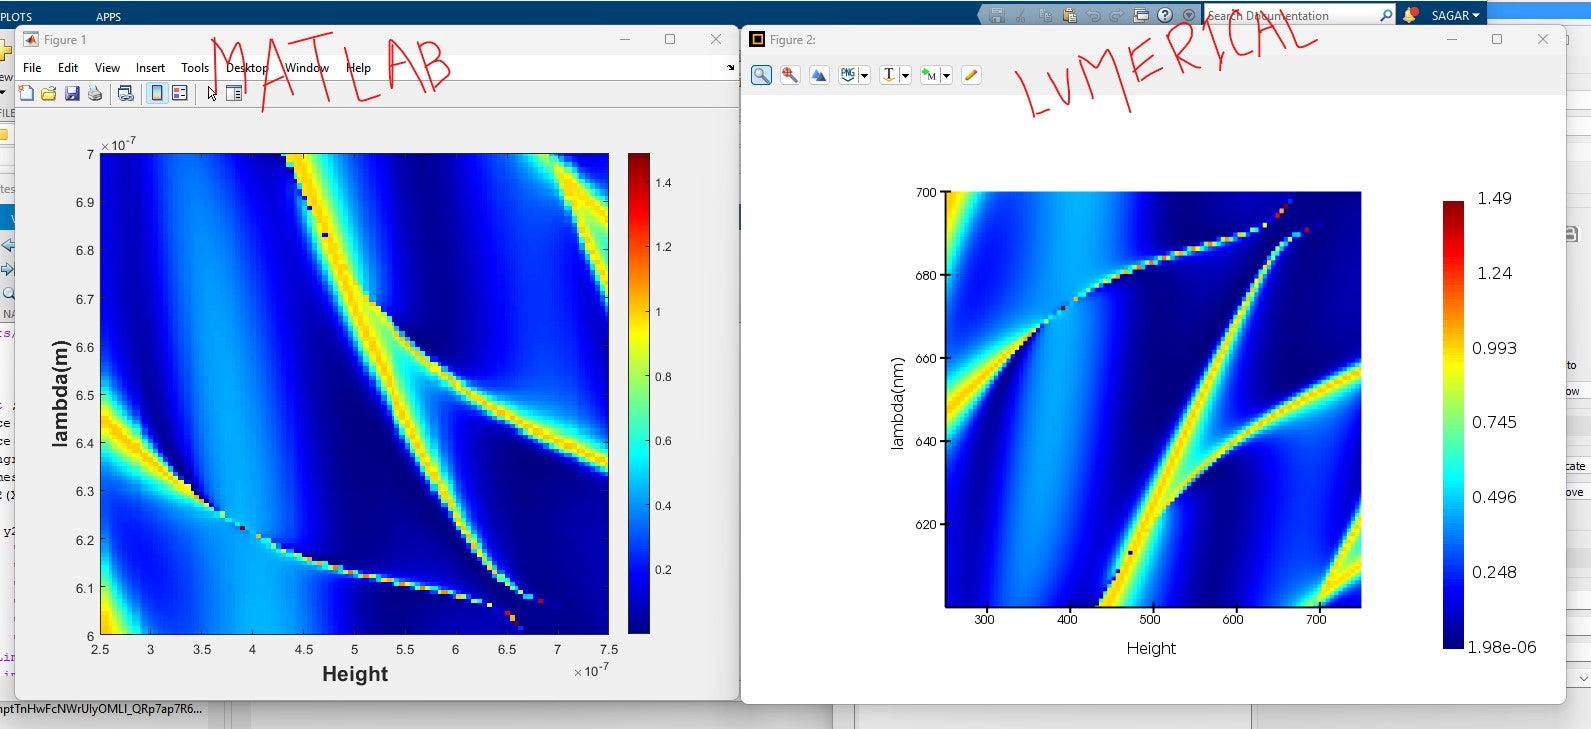
SubscriberThe left side was plotted from Lumerical and the right side was plotted by Matlab after extracting sweep data from Lumerical. You can see along with the orientation of the axis of the graph; there are issue in the whole images, the coloured lines are bent. How to resolve this issue. This time I copied the data from numerical and plotted by Matlab.
-
July 4, 2023 at 2:26 pm
Guilin Sun
Ansys EmployeeYes, obviously.
Lumerical monitor records actually the frequency, not the wavelength by default. So the wavelength is not equi-spaced if you did not specify equi-wavelength. Lumerical script can know it is frequency or wavelengh in plot. However the matlab does not know this. So it assumes the wavelength is equi-spaced. Please either
1: plot in frequency
2: interpolate the result with equi-wavelength spacing before exporting to Matlab, or set to record equi-wavelength in the monitor and redo the sweep. It is better to inteploate the result.
-
August 27, 2023 at 1:40 pm
simenew.assefa
SubscriberHow can I export FDTD viualized image to Matlab Image?
-
August 27, 2023 at 1:44 pm
simenew.assefa
SubscriberIt say could not open a connection Matlab, you must have asupported version of maatlab installed to usi this version feature. Please the manual for this detail.
-
August 28, 2023 at 3:57 pm
Guilin Sun
Ansys EmployeeThe MATLAB script integration feature requires MATLAB version 2006b to 2019a. The following links might be helpful:
MATLAB script integration configuration guide
MATLAB - Lumerical integrations
Creating vector plots with MATLAB
-
September 3, 2023 at 5:17 am
xuanlunhuang20
SubscriberFor the orientation of the figures, you need to make sure that which dimension of your result matrix corresponds to height and which to lambda. You might need “transponse” function in Lumerical or “axis xy” and “flipud” function in MATLAB.
For the problem of inconsistency between two figures, you might need these codes, which is answered by Dr. Sun in my previous post: (This is just an example, you can change it according to your needs)
E2=getelectric(“monitor”);#get your result
x=getdata(“monitor”,“x”)
y=getdata(“monitor”,“y”);
mx=100;#x points in matlab
my=50; #y points in matlab
xmatlab=linspace(min(x),max(x),mx);
ymatlab=linspace(min(y),max(y),my);
E2matlab=interp(E2,x,y,xmatlab,ymatlab);#interpolation
Because the “image” function in Lumerical will change the axis space automatically, the axis space in MATLAB does not equal to that in Lumerical. This leads to the inconsistency between two images. -
September 5, 2023 at 3:17 pm
Guilin Sun
Ansys EmployeeHi @xuanlunhuang20, thank you for help!
Lumerical script uses the mesh point values, whereas Matlab re-interpolates the axis to equal spacing. therefore distortion occurs.
-
- The topic ‘Issue in 2D colour map data export in matlab’ is closed to new replies.


-
5084
-
1823
-
1387
-
1248
-
1021

© 2026 Copyright ANSYS, Inc. All rights reserved.


