
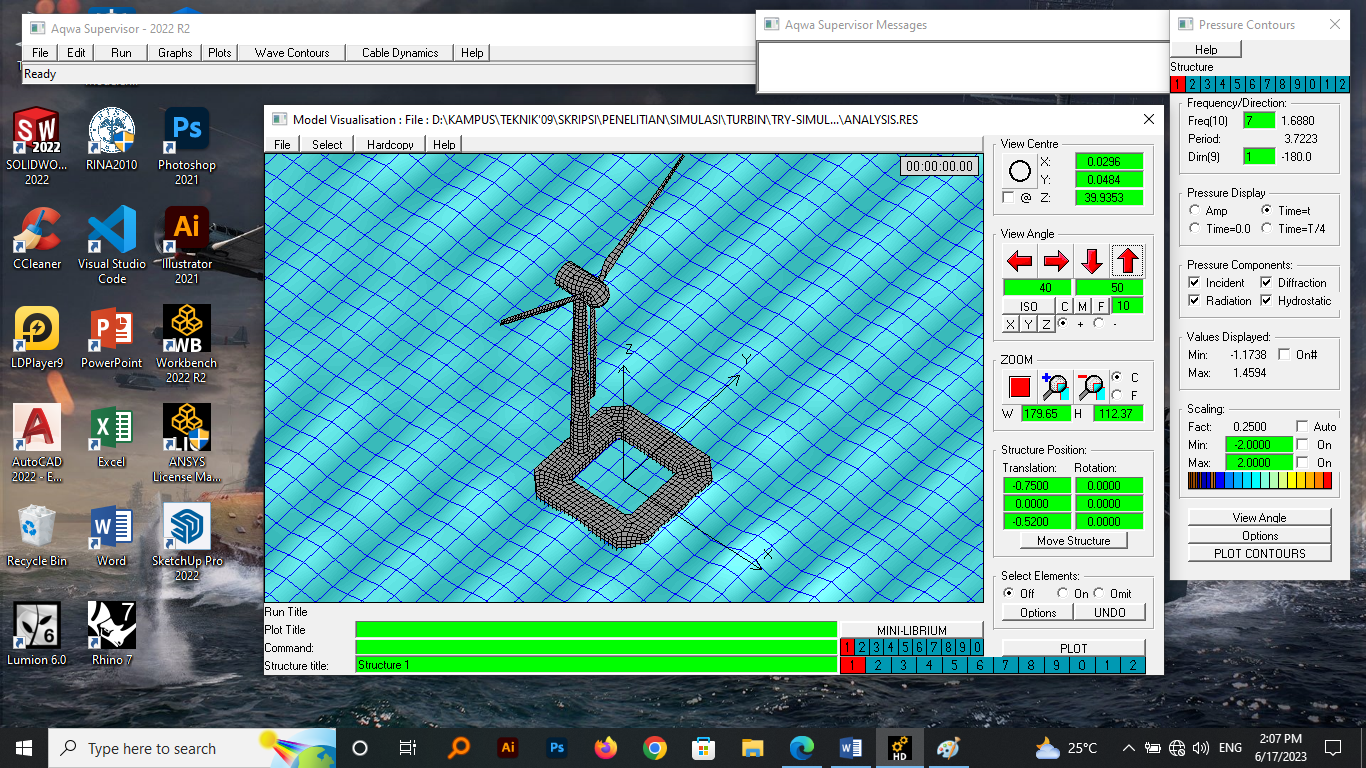
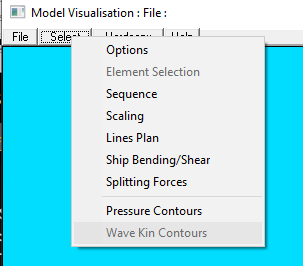
How to plot wave surface elevation in ansys Aqwa GS


Viewing 2 reply threads
- The topic ‘How to plot wave surface elevation in ansys Aqwa GS’ is closed to new replies.


