-
-
June 11, 2023 at 3:07 pm
James
SubscriberHello everyone!
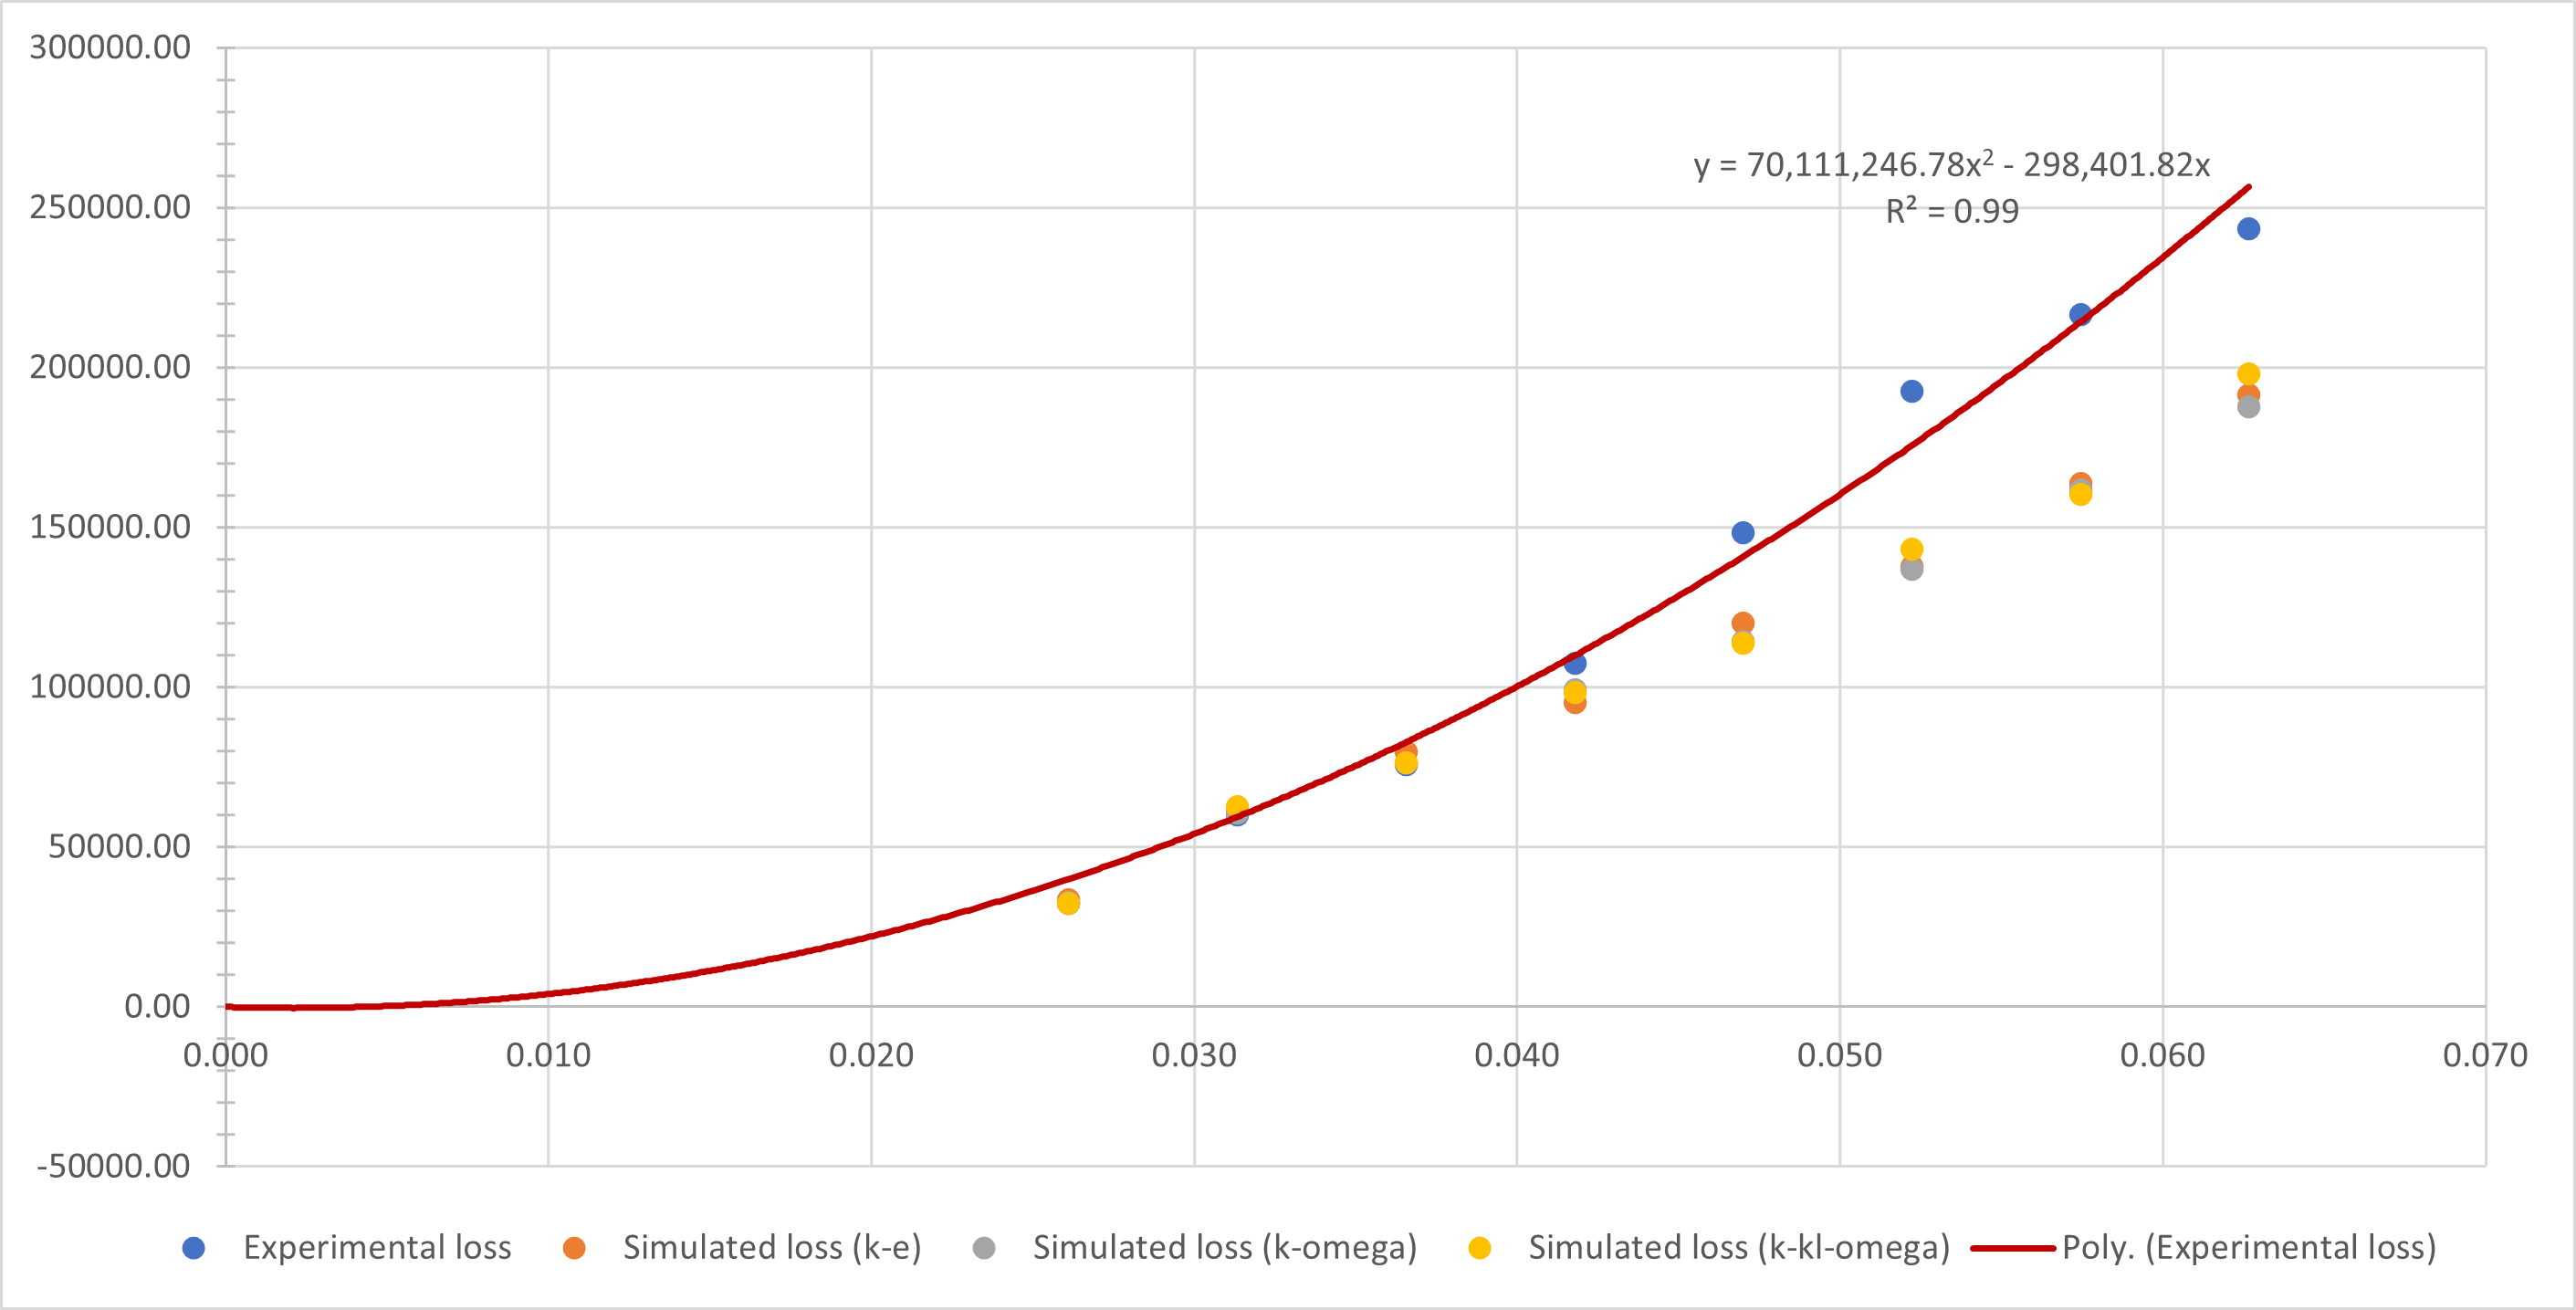
I have experimental pressure drop data across a porous zone and I calculated the inertial loss and viscous resistance coefficients as mentioned in fluent documentation. Although I do get good pressure drop at lower velocities, the drop seems to diverge as velocity increases. I also tried using different turbulence models and they give consistent data among them but they all diverge from experimental data. Any suggestions?
My computational domain is quite simple: a straight pipe with 3 cm of porous medium in the middle. The fluid I am using is water.
-
June 12, 2023 at 11:08 am
SRP
Ansys EmployeeHi,
Perform a sensitivity analysis of the influential parameters in your simulation, such as change key parameters such as porosity, permeability, turbulence parameters, or non-Darcy coefficients to assess their influence on the results. By systematically varying these parameters within reasonable ranges, you can identify which factors have the most significant impact on the pressure drop predictions
At higher velocities, the flow in porous media can exhibit non-Darcy behavior. Non-Darcy effects, such as inertial and non-linear resistance, can become more pronounced and influence the pressure drop. Investigate if non-Darcy effects need to be accounted for in your simulation. This may involve incorporating Forchheimer’s equation or other non-Darcy flow models. You can refer to paper DARCY’S AND FORCHHEIMER’S LAWS IN PRACTICE. PART 2. THE NUMERICAL MODEL by wojciech Sobieski
Hope you will this paper useful.
Thank you.
-
June 12, 2023 at 11:15 am
James
SubscriberAppreciate it mate. I'll check it out
-
-
June 12, 2023 at 1:59 pm
Rob
Forum ModeratorJust a comment. Where are you taking the pressure values? Don't forget the wall drag is in addition to the porous media.
-
June 12, 2023 at 2:50 pm
James
SubscriberHello mate, I set a manometer about 20cm higher from the inlet of my reactor. As for the wall drag, the inlet of the reactor has several small channels through which the water passes and it doesn't actually touch the walls at all. The channels are there for homogenous distribution of water.
-
-
June 12, 2023 at 3:53 pm
Rob
Forum ModeratorI mean the walls around the porous media! Some pictures might help clarify things.
-
June 12, 2023 at 4:50 pm
James
SubscriberI see, my apologies. I did not consider that. Below you can see the picture of the entire reactor. I am just using the middle part. The bottom part of the middle portion is supposed to be the porous fluid volume. I, for some reason, created the porous medium in the center of the middle section. Could that be a reason for the divergence? Furthermore, the value of alpha from the pressure drop data was negative, but when I used that value, the simulated pressure drop was much lower, even for smalled velocities. The simulated data you see above was due to the positive value of alpha.
-
-
June 13, 2023 at 9:07 am
Rob
Forum ModeratorNo worries - text does lose a fair bit in the writing and reading.
Alpha can't be negative, it'll break the porous media maths. There's a reason the intersept is always at y>0 on the porous calc graphs.
If you consider the pressure loss over the system you have several parts to the total (sum) loss. Friction, expansion/contaction and acceleration/jets. Depending on where you got the dP data from in the experiment compared to the porous media (remember the coefficients are per metre - did you scale the coefficients to the domain length to mimic reality?) it's very easy to get a difference.
-
June 13, 2023 at 12:27 pm
James
SubscriberGood afternoon Rob,
I did consider the pressure drops due to the channels but there is no way for me to experimentally measure that drop. I tried using the entire domain but the pressure drop was way lower, so as a last resort I used just the middle portion and that's the closest I've ever gotten. I did consider the fact that as the water reaches the porous zone, the pressure maybe different and I did calculate it theoretically according to the Bernoulli's equation, found the porous zone parameters and applied it to the current model but the values weren't any close. Perhaps I should replicate the fluid domain right from the place I set the manometer...?
Also, I should have added the axis titles, the x-axis is velocity in m/s and the y-axis is pressure (in Pa) at the inlet of the reactor (My manometer isn't sensitive enough to measure the outlet pressure).
-
-
June 13, 2023 at 1:07 pm
Rob
Forum ModeratorIf it's a multiphase system what is the phase composition on the filter? With Eulerian you can set coefficients on a per phase basis, I can't remember if that's the case for VOF. An already wetted filter may also behave differently to a dry filter: the sponge you may use when washing dishes is a good example of that.
-
June 13, 2023 at 2:02 pm
James
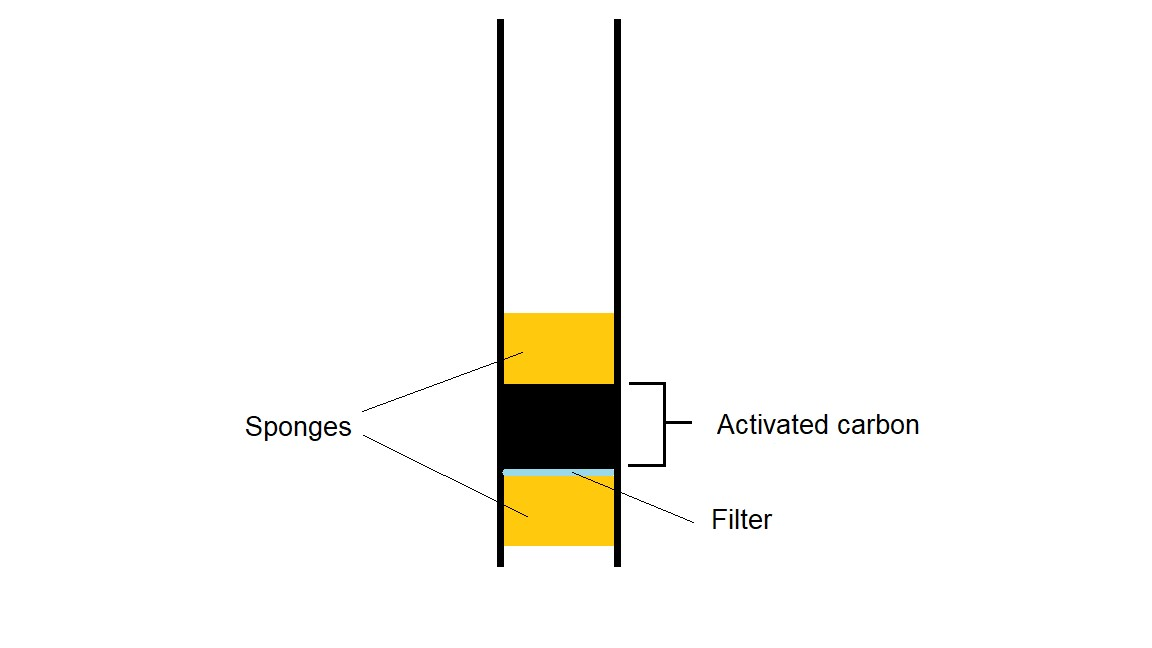
SubscriberWell, the porous zone is activated carbon. I am, however, using sponges above and below the carbon as well as filter paper below the carbon but above the bottom sponge, like in the picture below. I didn't include sponges and the filter paper in the simulation because:
1) The pressure drop is too low for me to measure.
2) I wanted it all to be a part of the entire porous media system.
For now, I've just been experimenting with single phase flow since it's just water that's been passing through the system. The sponges were wetted before but before I restarted the experiment, I did squeeze the excess water out and the filter paper was brand new. But...this shouldn't affect the simulations, right?
-
-
June 13, 2023 at 2:35 pm
Rob
Forum ModeratorIf you're filling the system as part of the experiment then pressure loss may also vary with time due to the liquid clearing gas pockets etc.
As a thought, did you set the porous media in the model as the total thickness or just the thickness of the carbon filter part? Just wondering if you've got a pressure loss for one part of the domain but calculated on another.
-
June 13, 2023 at 3:01 pm
James
SubscriberI did let the experiment run for a few seconds for the needle to stabilize. If there was any change in pressure loss, it must have been too small ro measure.
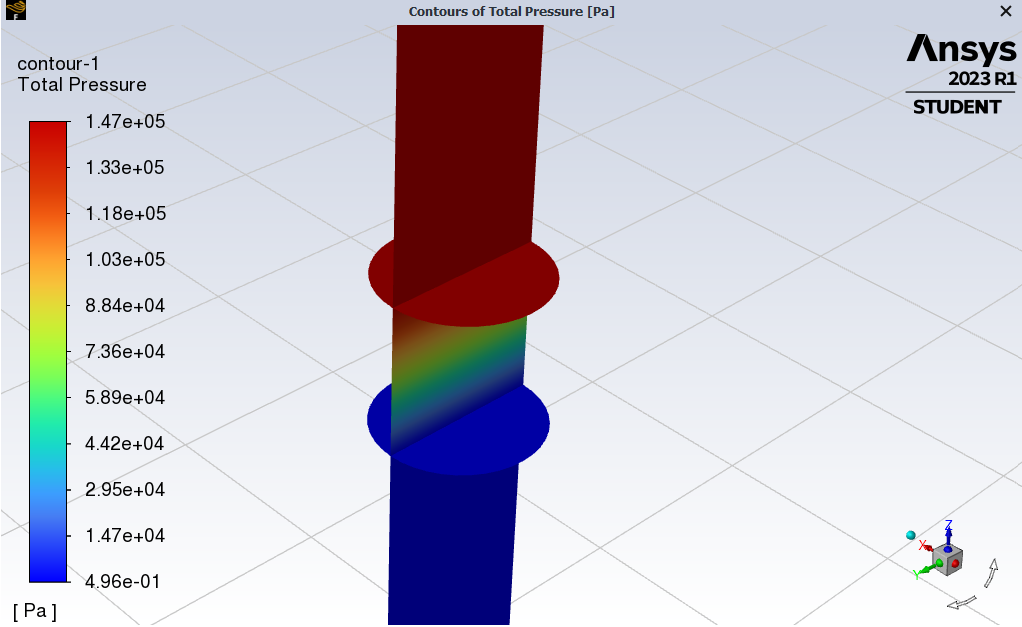
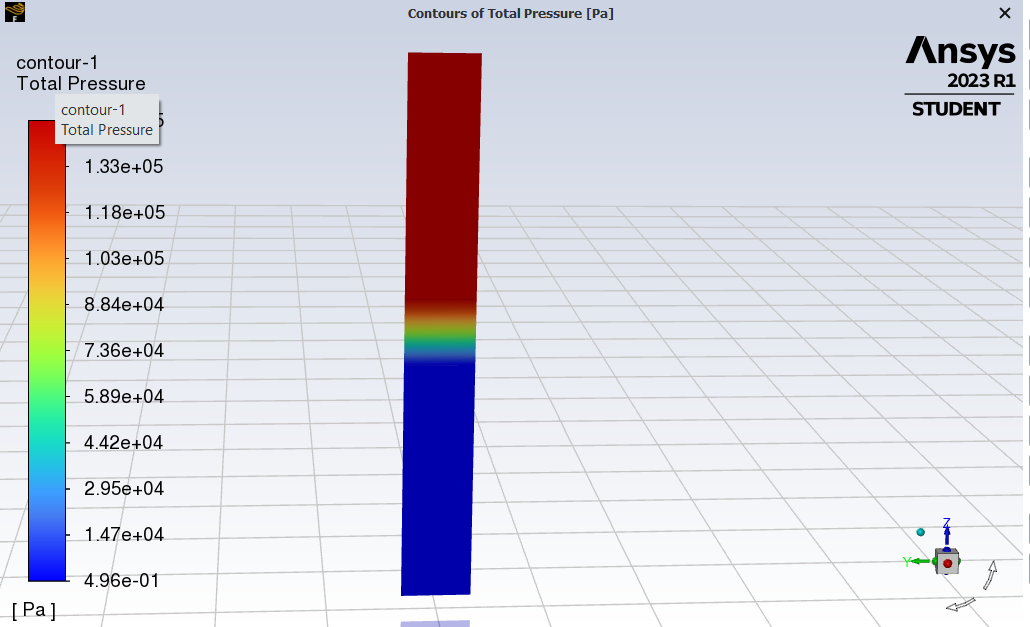
Just the size of the carbon. I used spaceclaim to slice the fluid volume to create the zone. I did think of adding the sponges but given that the pressure drop was just too small, I didn't include them. You can see the pressure drop in the images below (The pressure here is not mentioned in the graph because I had tried using the negative value of alpha).
-
-
June 13, 2023 at 3:58 pm
Rob
Forum ModeratorThat should be fine.
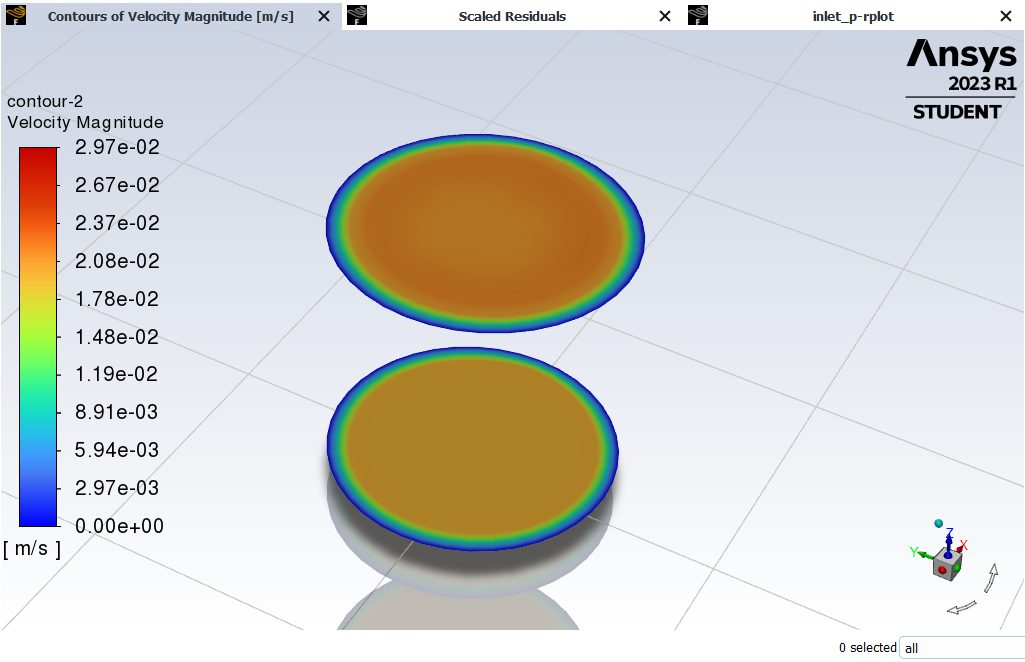
Can you plot the velocity on the interior at each end of the porous media? Use local range & create two contour plots. We're possibly straying into the "engineering knowledge" bit of the forum rules so I may not beable to answer fully.
-
June 13, 2023 at 5:03 pm
James
SubscriberQuite alright mate, you've helped plenty.
Here ya go! The top is the inlet and the bottom, the outlet. The mass-weighted average velocity of the porous inlet and the outlet is 0.020561991 m/s and 0.019718834 m/s respectively.
But, not to stray away from the original question, any other tips you could give me to improve simulated pressure loss at higher velocities?
-
-
June 14, 2023 at 12:37 pm
Rob
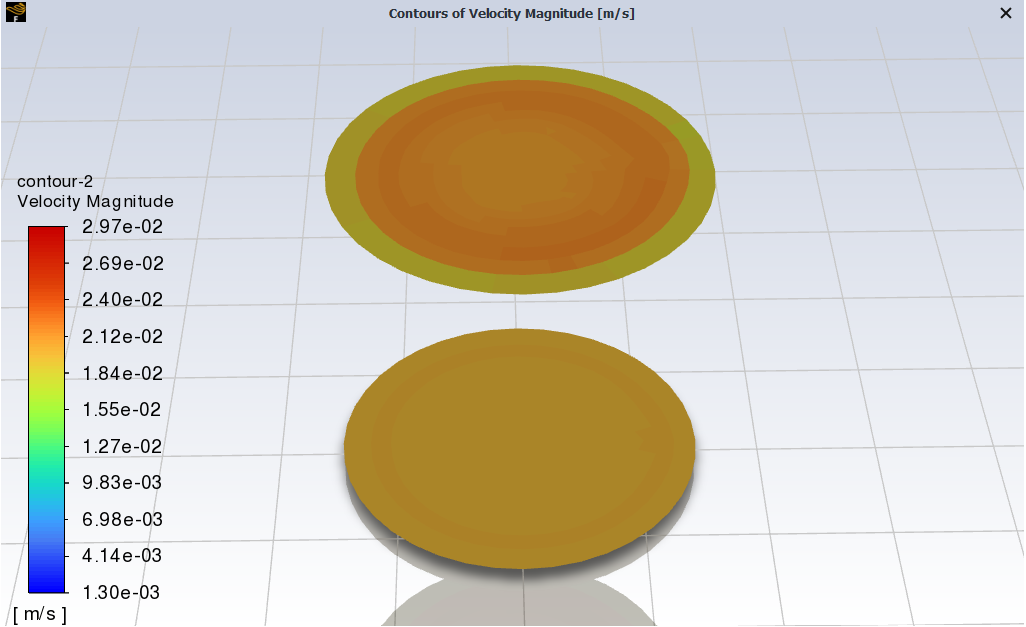
Forum ModeratorPlease can you replot with node values off? Just want to check the resolution. The reason I asked for the above was to see if the narrow pipes at each end did anything to the flow at the porous block.
-
June 14, 2023 at 3:09 pm
-
-
June 14, 2023 at 3:39 pm
Rob
Forum ModeratorThat's the one. It removes the contour smoothing, and in this case suggests you may want to review the mesh resolution. You can also plot the mesh on the surfaces, but I think you've set too high a maximum cell size in this case.
Combine that with the resistance coefficients (they're high but I've seen worse) and I can see why the results may drift a little.
-
June 14, 2023 at 5:54 pm
James
SubscriberAh excellent! I'll give it a go. It must be due to the inlet volume which I set the max size to 3mm to reduce computational cost. But anyway, thanks mate! you are a legend.
-
-
June 15, 2023 at 10:56 am
Rob
Forum ModeratorThat's the reason CFD engineers used to spend weeks building meshes: we used to have to model everything with 100k cells.... In block hex. In the current state, we rely on the automatic tools but the trade of can be a higher cell count if you're not careful.
-
June 15, 2023 at 2:10 pm
James
SubscriberThanks again bruv, appreciate it
-
-
- The topic ‘pressure drop across porous zone doesn’t match at higher velocities’ is closed to new replies.


-
4678
-
1565
-
1386
-
1242
-
1021

© 2025 Copyright ANSYS, Inc. All rights reserved.

