TAGGED: Discovery AIM
-
-
May 25, 2021 at 2:11 pm
thornyak
SubscriberHello!
If I have a multi-step analysis, how can I generate a maximum/minimum over time result? I would like to see e.g. the maximum stresses at each node from all of the steps.
-
May 26, 2021 at 7:22 am
Charudatta Bandgar
SubscriberHello Tamas
You can select the chart option for the maximum value in results to plot maximum stress over all the steps as a graph.
Â
Regards.
-
May 26, 2021 at 7:39 am
thornyak
SubscriberHello Charudatta BandgarÂ
I mean, plotting maximum over time (over steps) result as a contour plot, not as a graph. If I have two or more loadsteps, I would like to see the critical areas (e.g. stresses) from all of the steps in one conotur plot result for the full geometry.
-
May 26, 2021 at 7:49 am
-
May 26, 2021 at 8:12 am
thornyak
SubscriberCharudatta BandgarÂ
Â
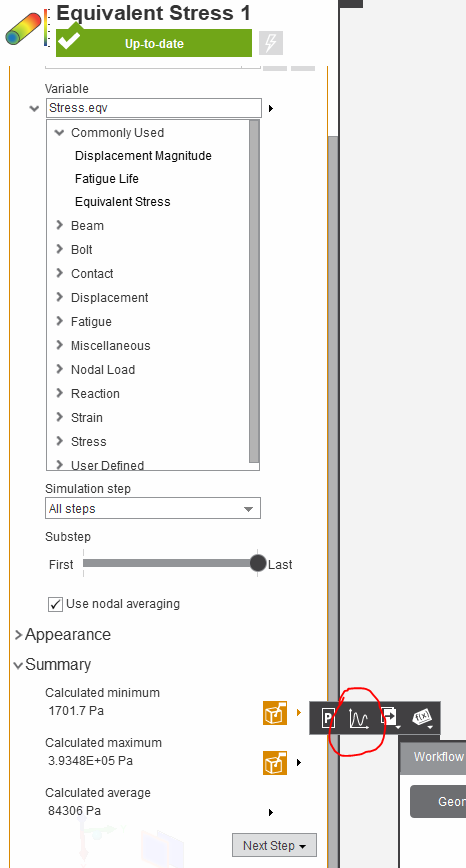
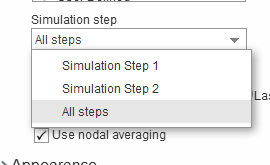
If I select "All steps" under "Simulation Step" and the slider under "Substep" was set to "Last", then I will only see the contour plot result for the last simulation step (if "All steps" selected, then Substep equals Simulation Steps), right?
Instead of this I need such a result that displays e.g. the maximum stresses from ALL steps in ONE contour plot. In this case the maximum values for each node (max(Step1;Step2;Step3;...)) are plotted on the screen, like an envelope result. This called in ANSYS Workbench as "Maximum/minimum over time".
-
May 26, 2021 at 10:35 am
Charudatta Bandgar
SubscriberTamas I think that is not possible in AIM.Â
-
May 26, 2021 at 10:39 am
thornyak
SubscriberCharudatta BandgarÂ
Okay, thank you
-
-
- The topic ‘Max/min over time results in AIM’ is closed to new replies.
-
6239
-
1906
-
1457
-
1308
-
1022
© 2026 Copyright ANSYS, Inc. All rights reserved.

