-
-
September 13, 2022 at 6:49 pm
Shak
SubscriberHello Sirs,
I am relatively new with the Fluent, and I need to clarify some questions,
I am currently modeling a fluid of solid particles and air with the Eulerian-Lagrangian approach, which those characteristics:
Particle --> diameter 0.0002m
Volume fraction--> 0.0012
Pressure gradient --> 198 Pa/m
Specularity coefficient --> 0.002
coefficient of restitution particle-particle--> 0.94
coefficient of restitution particle-wall--> 0.7
Pipe --> verticalI have some questions about modeling; could you please help me with them?
1. It is still unclear whether I should model it with the DPM option or the DDPM option because I have a small volume fraction. Still, on the other hand, according to the volume fraction, it should be analyzed as a two-way coupling (Elghobashi paper), so I should consider the collisions between particles and between particle-wall.2. Is it possible to input the pressure gradient and velocity into my solution, or should we just input one of those values?
3. Using the DDPM option, Is it ok to put the coefficient of restitution of particle-particle as follows?
2.- Using the DDPM option, how can I introduce the coef. of restitution of particle-wall?
Thank you in advance for your answers.
-
September 14, 2022 at 7:12 am
Amine Ben Hadj Ali
Ansys Employee1)DDPM is required if you have in average high volumetric loading.
2)Which pressure gradient? You can always add a momentum source term.
3)That is your user input. if you do not know leave defaults.
4/DPM Wall Interaction Panel.
-
September 14, 2022 at 8:53 am
Rob
Forum ModeratorTwo way coupling means the particle momentum/temperature is seen by the flow field. Otherwise the trajectories are governed by the flow but the flow isn't affected by the particles. Particle-particle is four way coupling.
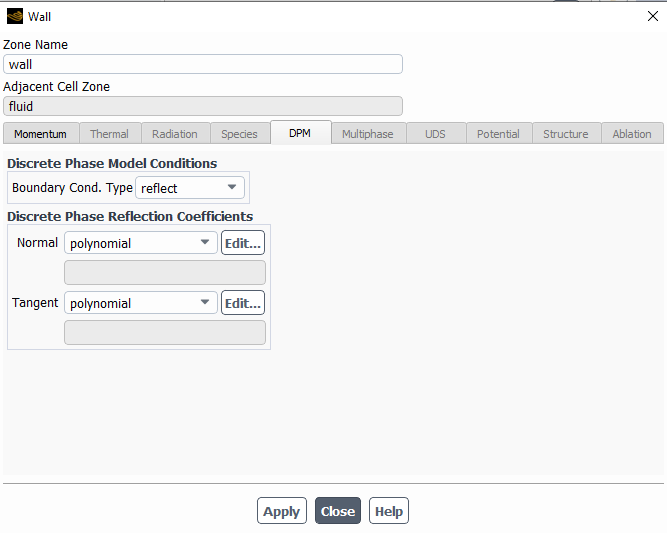
Wall rebound tends to be set in the wall boundary condition, under DPM.
-
September 15, 2022 at 2:02 pm
Shak
SubscriberHello Sirs,
Thank you very much for your answers.
I would like to ask you the following about DPM:
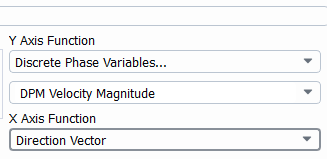
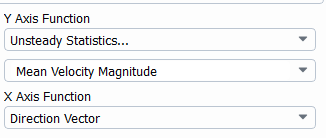
1) How can the coefficient of restitution be entered in the DPM option?2) in the DPM option, what is the difference between plotting unsteady statistics instead of DPM Variables?
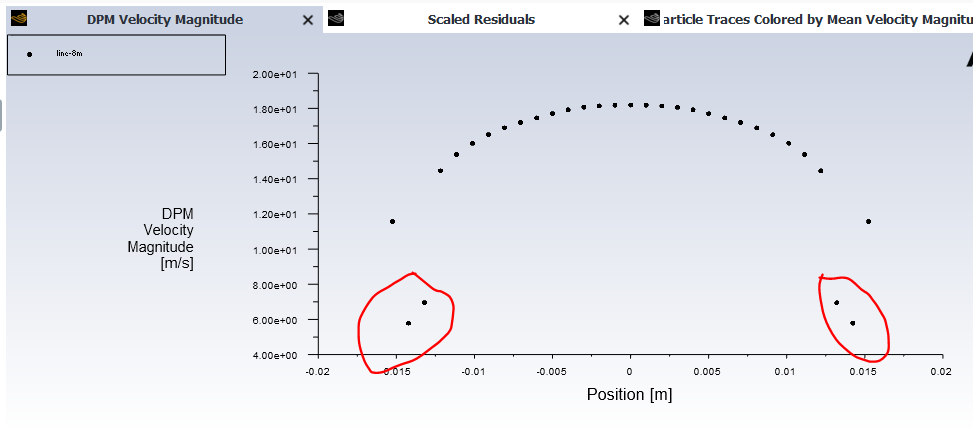
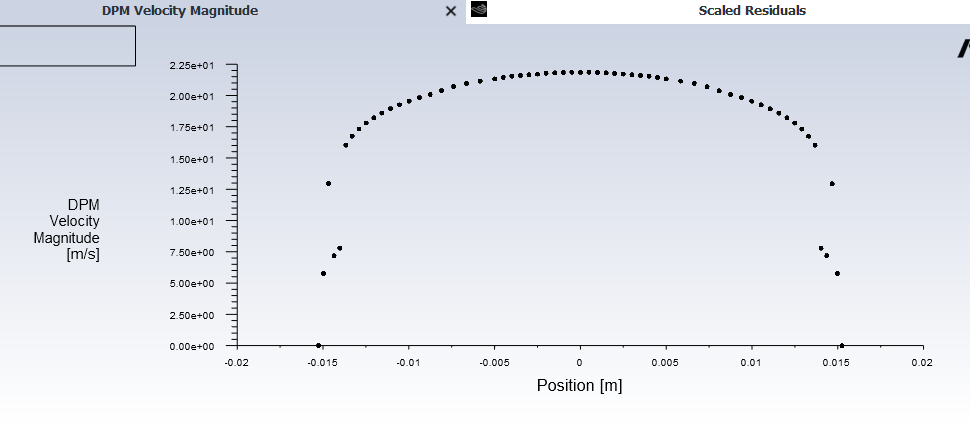
3) When I simulate the transient option, the velocity profiles I get are the following, but I have doubts because some points appear in the DPM velocity magnitude. How can I plot it correctly?
Thank you in advance.
-
September 15, 2022 at 3:42 pm
Rob
Forum Moderator1) Open the wall panel up. Check it's set as reflect in the DPM tab.
2) Read the definitions in https://ansyshelp.ansys.com/account/Secured?returnurl=/Views/Secured/corp/v222/en/flu_ug/flu_ug_fvdefs.html
3) Can you plot the flow velocity in that region? Depending on how the flow is behaving near the wall(?) you may have a problem with the flow.
-
September 16, 2022 at 12:56 am
Shak
SubscriberHello Sir, thanks again for your answers
1) Yes, it is reflected. Thank you I found the option.
3) Let me attach the flow velocity profile in the same region
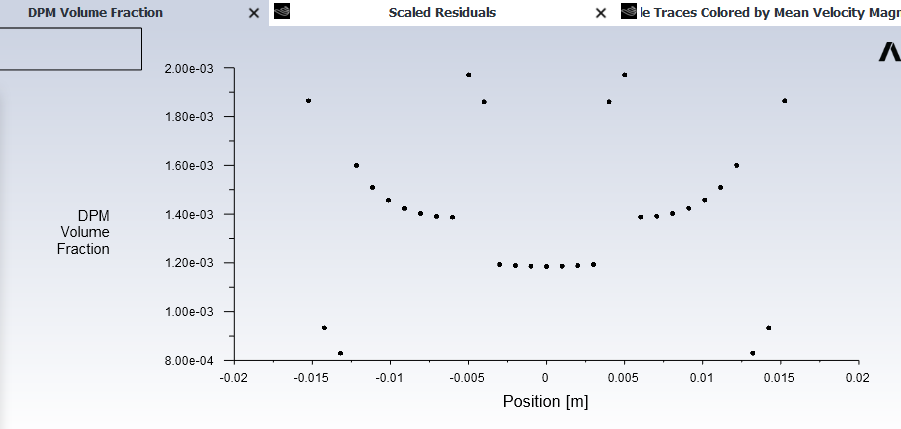
4) Excuse me, I also observed that the volume fraction results present different values; I'm not sure what the problem is with my simulation; please, could you give me any recommendations?
Thank you in advance.
-
September 16, 2022 at 9:20 am
Amine Ben Hadj Ali
Ansys EmployeeThe averaged DPM quantities might be sometimes unreliable towards the wall as we need to transfer discrete information to Eulerian Grid information. So better to rely on discrete information when using DPM
-
September 16, 2022 at 10:54 am
Rob
Forum ModeratorDPM Volume Fraction is calculated per cell. If the cell size changes rapidly, or there are very few parcels in that area the results can be a little misleading. Read the definition in the link I shared.
-
September 18, 2022 at 11:37 pm
Shak
SubscriberHello Sirs,
Thank you for your answers.
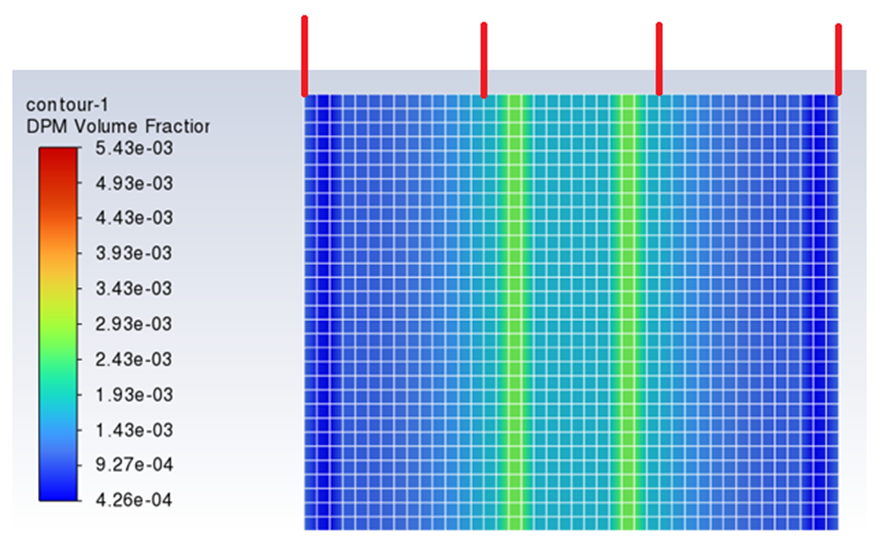
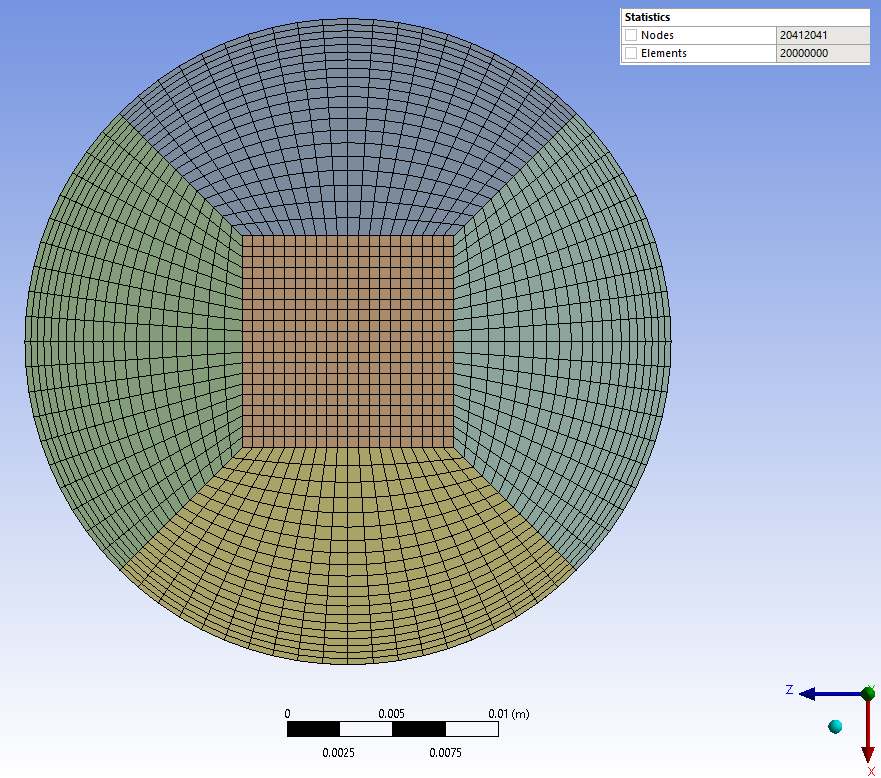
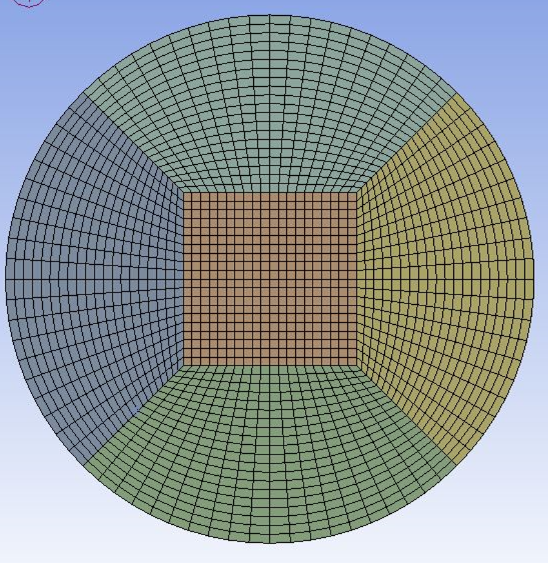
I have read the link you provided me, and I wanted to tell you that I have been reviewing the mesh; my pipe is 30 mm in diameter, and the particle diameter is 0.2mm.
The structured mesh I have made has a square in the center (10mm x 10mm), and each cell is approximately 0.7mm (just over 3 times the diameter of the particle).
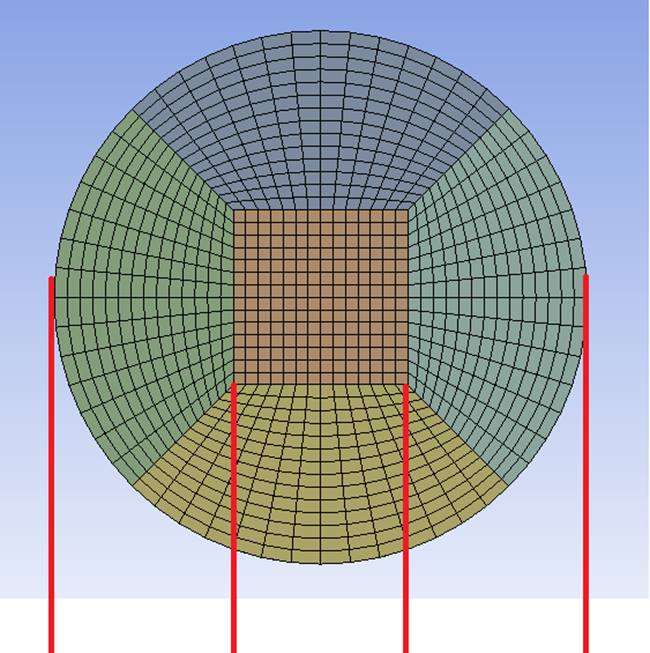
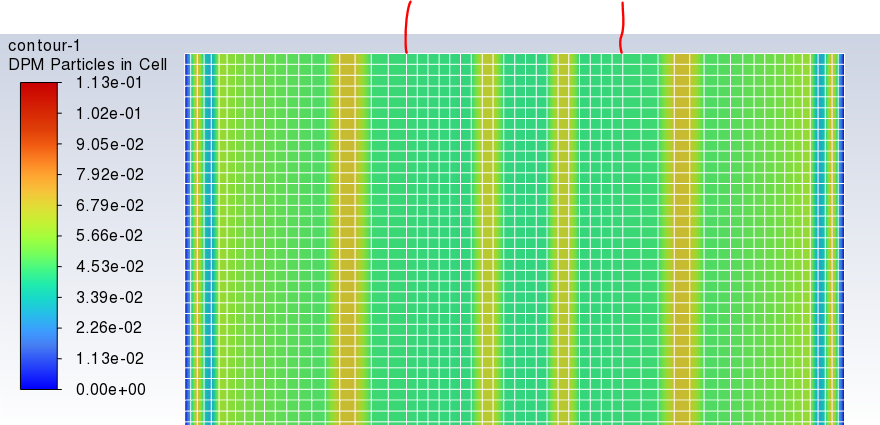
I am noticing that just in the central area (where the square is), the volume fraction distribution is more homogeneous, but after that, its values fluctuate, concentrating closer to the walls of the square. I understand that it is due to the geometry of my pipe (I have drawn some red lines so that the dimensions of the square can be better reflected)1) Please, could you give me some recommendations to improve my results?
2) I understand that my cell must be larger than the diameter of my particle; however, my question is: How can I get better results close to the wall if I have to keep that cell size condition?
I appreciate any help you can provide.
-
September 19, 2022 at 8:25 am
Amine Ben Hadj Ali
Ansys EmployeeTry to have a near wall goog mesh resolution and ignore that "requirement" to have particles smaller than the mesh size. Again are you using DDPM? Aslo assess a mesh with small cell size change (applies to the region with the O-Grid).
-
September 20, 2022 at 5:36 am
Shak
SubscriberDr. Armine, thank you for your answer.
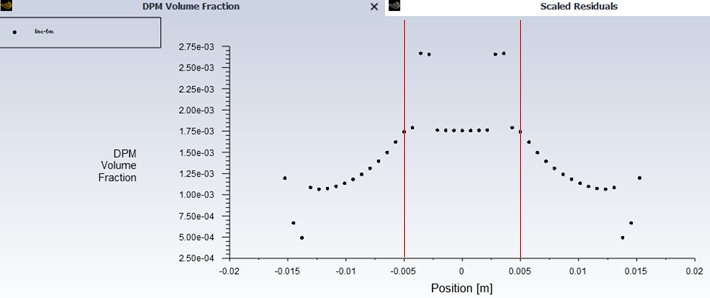
I was using the DPM option and refined the mesh especially close to the wall, but I still have the same question: why do I have this accumulation of particles in different areas?
I know that the DPM option doesn't consider the volume fraction; however, it is unclear why the concentration of particles in the cell is not homogeneous.
On the other hand, the slip condition is only fulfilled by the fluid flow. However, I noticed that in the velocity profile of the particle, the velocity at the wall is 0 m/s. Please could you tell me how to improve my simulation?
Many thanks for considering my request.
-
September 20, 2022 at 6:07 am
Amine Ben Hadj Ali
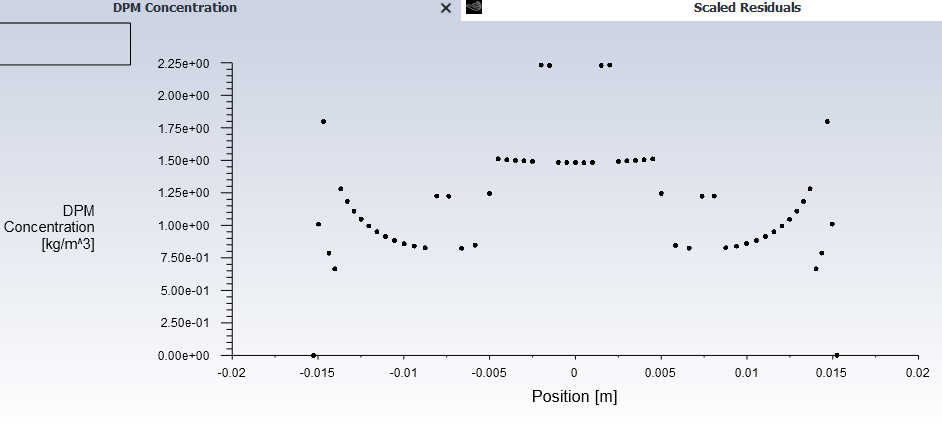
Ansys EmployeeHow does the DPM concentration plot look alike?
Again DPM is discrete and what you are visualizing now is the trial to "Eulerian"inze the discrete information on computational grid.
-
September 20, 2022 at 6:07 am
Amine Ben Hadj Ali
Ansys EmployeeDisable node values in the plot too.
-
September 20, 2022 at 3:39 pm
-
September 20, 2022 at 3:42 pm
-
September 20, 2022 at 3:56 pm
Amine Ben Hadj Ali
Ansys EmployeeThe plot is not smooth but looks better than the DPM VOF one. Can you just try a simple uniform mesh?
-
September 20, 2022 at 9:46 pm
Shak
SubscriberHello Dr. Armine,
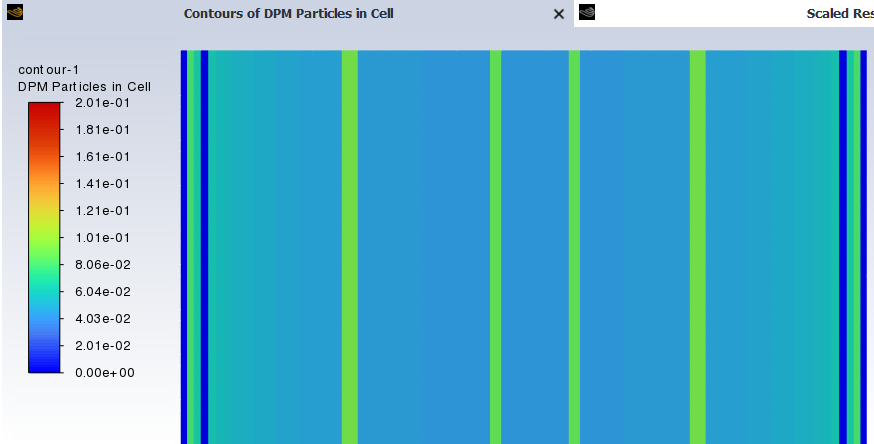
I used the following mesh without any refinement close to the walls (uniform mesh), and I got the following:
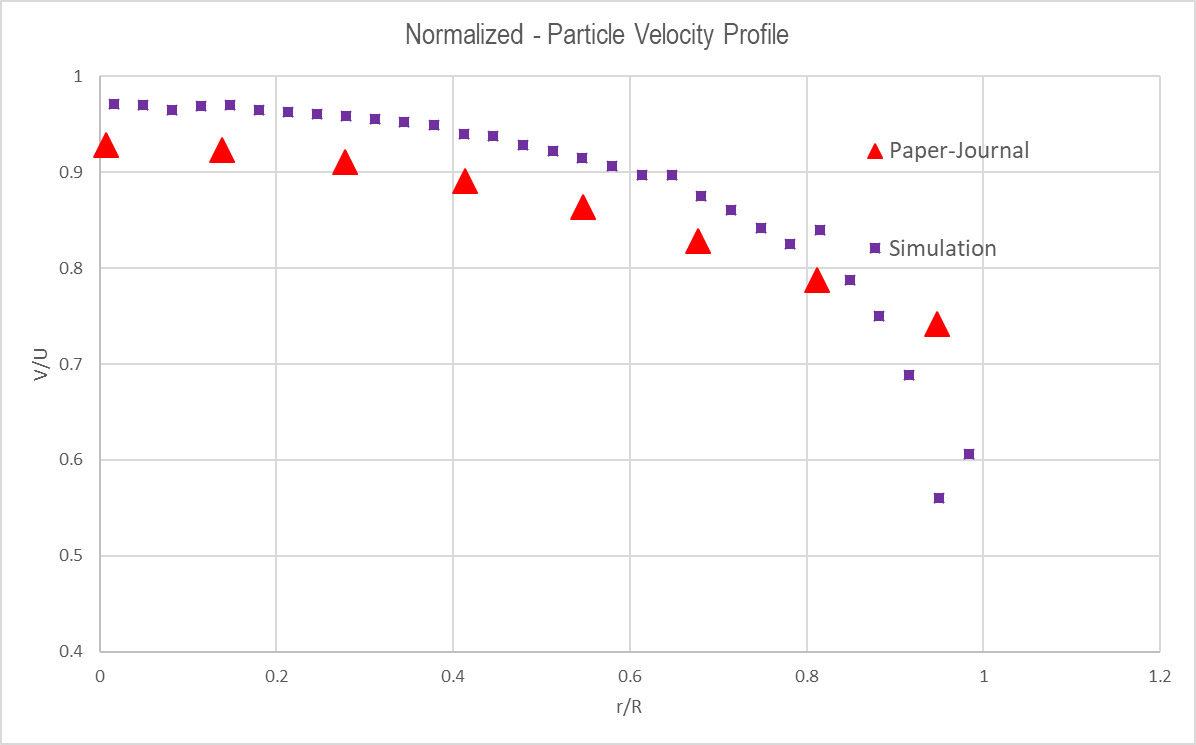
But I still have problems getting the velocity profile of the particles; I am trying to re-create the results in red (see Velocity profile), where the velocity at the wall is different from 0.
Thank you.
-
September 21, 2022 at 9:14 am
Rob
Forum ModeratorWhat did they normalise the data to in the paper? You're off by about the same amount until you hit the near wall, and you won't be the first person to have missed a (hidden) factor in published experimental data.
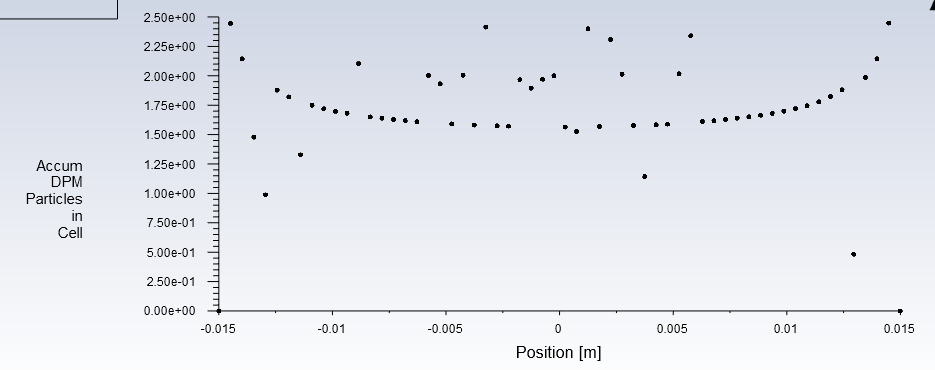
Re the concentration plots. Plot cell volume on the same line, I suspect it's a case of particles per volume being slightly off, rather than a problem with the results.
-
September 21, 2022 at 9:55 am
Amine Ben Hadj Ali
Ansys EmployeeI think the results are fine just check what Rob mentioned ( assuming in the picture your results are the violet squares)
-
September 22, 2022 at 12:49 am
Shak
SubscriberHello Sirs,
They normalized the data to compare the velocity of the particle (V) vs the velocity of the fluid (U) and check the slip velocity between both (my results are the violet).
I plot the DPM particles in Cell (Steady DPM Statistics> Accum DPM particles in cell)
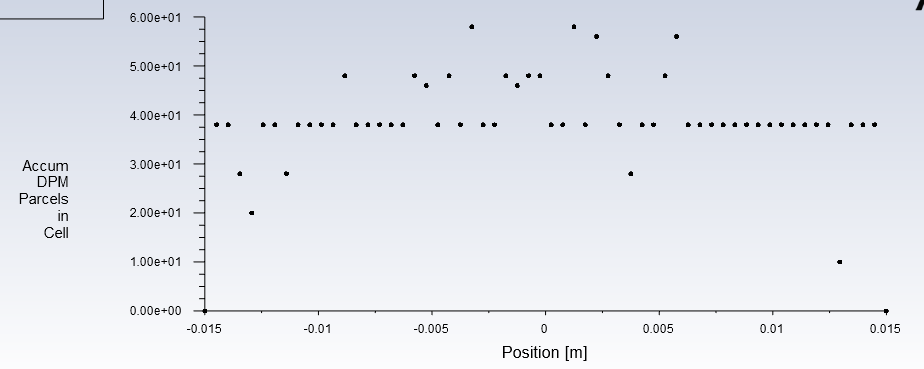
Also, I plot the Parcels in Cell (Steady DPM Statistics> Accum DPM Parcels in Cell)
I will be attentive to your comments. Thank you very much.
-
September 22, 2022 at 8:25 am
Amine Ben Hadj Ali
Ansys EmployeeWhat shall we now comment? Your plot for the velocity is fine. I am not sure whatelse I should write here without the need to do it on my own and look into the file.
Again: for DPM I will only 100% trust the Discrete information. As you require the Eulerian variant of that information you might see some "noise" and "artifacts" for the reasons we listed in this whole thread!
-
September 28, 2022 at 3:09 pm
Shak
SubscriberI thought Rob was asking me to send you those graphs, but if not, thank you very much for your responses.
I only have one doubt left; I am simulating, and this is appearing to me: "Custom field functions for steady statistics are not defined"
Please, could you tell me why is that appearing to me? Thank you in advance.
-
September 28, 2022 at 4:00 pm
Amine Ben Hadj Ali
Ansys EmployeeProbably you selected to do data sampling for Custom Field Functions but you did not select any function.
-
-
September 28, 2022 at 3:52 pm
Rob
Forum ModeratorIf you're using the steady statistics have you told the solver to include the custom field functions in that list?
Re the graphs, some cells have more particles (by chance) so give you some scatter in the concentration values.
-
- The topic ‘DPM model VS DDPM model’ is closed to new replies.


-
4612
-
1515
-
1386
-
1209
-
1021

© 2025 Copyright ANSYS, Inc. All rights reserved.


