-
-
September 12, 2022 at 10:30 pm
ianyylai
SubscriberHi all,
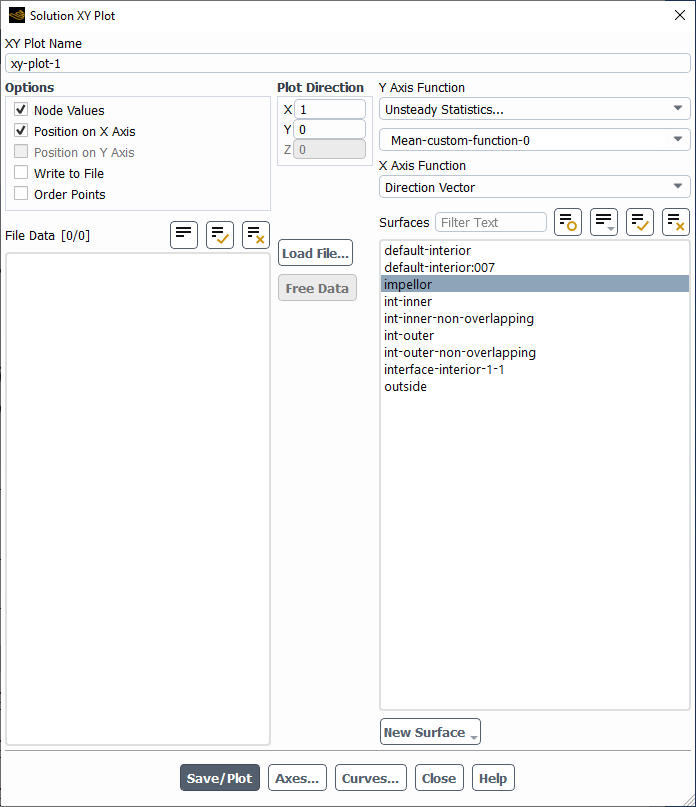
I would like to ask about the values generated by XY plots (Results >> Plots >> XY Plot). I am hoping to output the time-averaged velocities (Unsteady Statistics >> Mean Velocity Magnitude on numerous lines) of certain regions of the geometry, but the values SEEM to be relative but not absolute. I am wondering if there is a way to make them absolute.
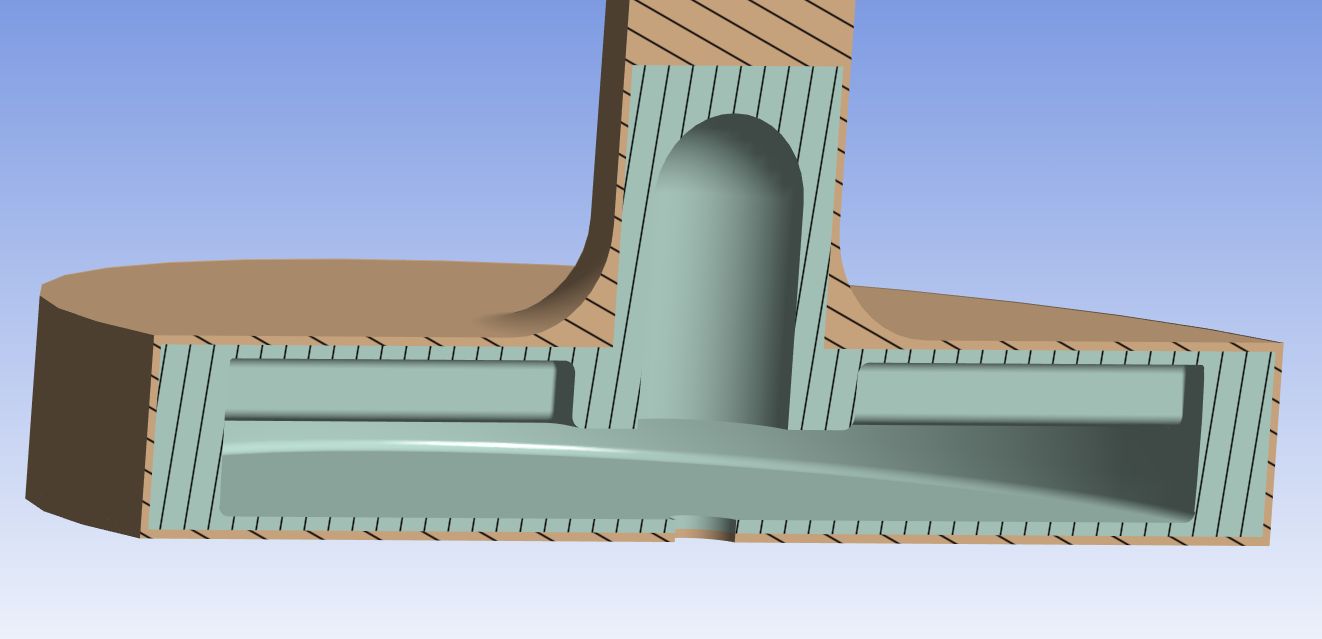
Imagine a cylinder, where the outer part (let's say radius > 3) is stationary domain and the inner (radius <=3) is the rotational. I am defining it's speed through Setup >> Cell Zone Conditions >> Fluids >> #name of the domain >> Mesh Motion >> define an absolute rotational speed. If it helps, I attached a picture of it. The orange part is stationary, green is the rotating part, and the vaccum at the center represents a rotor where no fluid passes through.
The trouble I am having now is that the velocities output by the fluids rotating region is very close to zero, making it convincingly like the RELATIVE velocity to the spinning rotor. A strong point to back up this claim is that the velocity output in stationary regions behave differently, having single-digit % error (with values of 5 to 8 m/s) while the problematic regions have nearly -100% (which means close to zero).
I would like to see if anyone knows any set up that fixes this, making the output of XY plots be ABSOLUTE, for the sake of post-processing. It would be very complicated to manually fix all those values in Excel since v=rw and at every solution location there is a different r value (Im trying to output v instead of w). I have scanned through the obvious ones but had no findings.
Thanks a lot!
-
September 13, 2022 at 9:01 am
Rob
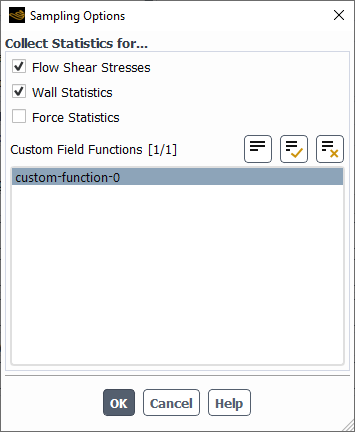
Forum ModeratorYou'll need a few custom field functions: look in the User Defined tab. The solver takes the "main" values for averaging, if we did everything we'd double the size of the data file and that might get a little large: 10-15GB is very doable with a relatively large mesh and multiphase, the combustion cases can get much larger.
-
September 14, 2022 at 9:30 pm
ianyylai
SubscriberHi Rob, that helps. Thanks.
-
- The topic ‘output presentation of XY plots’ is closed to new replies.


-
4618
-
1530
-
1386
-
1210
-
1021

© 2025 Copyright ANSYS, Inc. All rights reserved.


