-
-
August 16, 2022 at 5:09 pm
mpeters2
SubscriberHello,
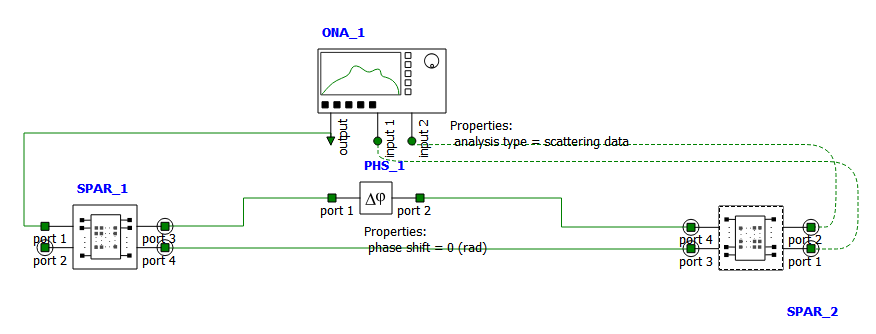
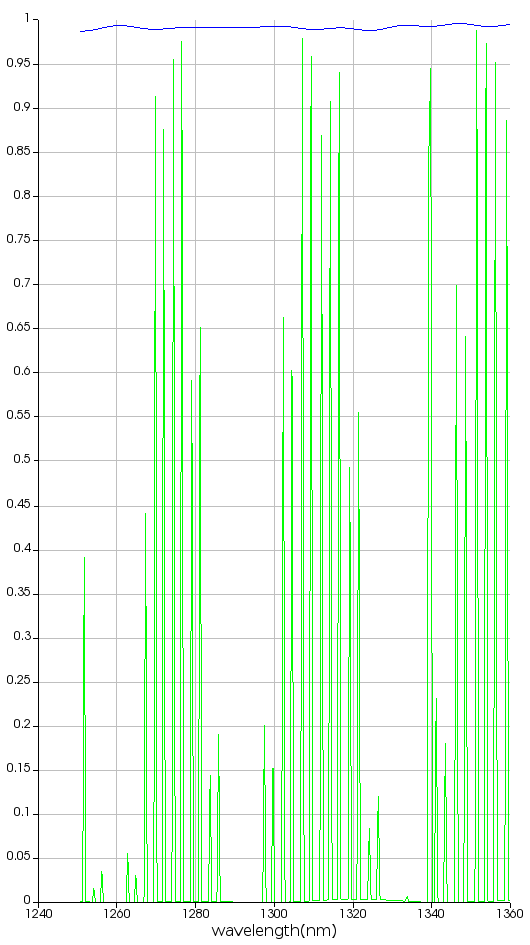
I have simulated a 3dB - adiabatic coupler in FDTD and composed a S matrix out of these simulations. When I put this S-matrix in Interconnect, for a single device, the simulation seems to be working as expected. However, when I put two devices next to each other (and expect all/most of the light to go back to one output port), unexpected transmission peaks appear at the other port. At these wavelengths the Interconnect simulation gives a total transmission that is larger than 1. (see figures)

Could you explain the origin of these peaks and/or how to solve this issue? Thank you in advance!
Best,
Maarten Peters
PhD student -
August 16, 2022 at 5:45 pm
Guilin Sun
Ansys EmployeeHi Maarten,
You are now simulating a MZ device. Thus the peaks in green color correspond to the resonance of the device.
I am not sure " a total transmission that is larger than 1". From the figure the max at each resonance is smaller than 1. ONA injects signal to the device uniformly so you should not sum up all the transmission.
-
August 18, 2022 at 7:13 pm
mpeters2
SubscriberHello Guilin,
Thank you for he reply. I understand we have a MZ device, but from the individual S matrix, we do not expect a resonance, as the phase shift is set to zero.
Furthermore, notice how there is two lines plotted in the figure, a blue, close to 100% transmission line (the expected transmission) plus a green, close to zero transmission line, which shows the weird spikes. When summing blue and green at the wavelengths where the spikes appear, a transmission >100% is measured.
Please let me know what to think of this.
Best,
Maarten
-
- The topic ‘Unexpected spikes in transmission spectrum interconnect’ is closed to new replies.


-
3597
-
1283
-
1117
-
1068
-
983

© 2025 Copyright ANSYS, Inc. All rights reserved.


